Pizza Hut 2001 Annual Report Download - page 60
Download and view the complete annual report
Please find page 60 of the 2001 Pizza Hut annual report below. You can navigate through the pages in the report by either clicking on the pages listed below, or by using the keyword search tool below to find specific information within the annual report.-
 1
1 -
2
-
3
-
4
-
5
-
6
-
7
-
8
-
9
-
10
-
11
-
12
-
13
-
14
-
15
-
16
-
17
-
18
-
19
-
20
-
21
-
22
-
23
-
24
-
25
-
26
-
27
-
28
-
29
-
30
-
31
-
32
-
33
-
34
-
35
-
36
-
37
-
38
-
39
-
40
-
41
-
42
-
43
-
44
-
45
-
46
-
47
-
48
-
49
-
 50
50 -
 51
51 -
 52
52 -
 53
53 -
 54
54 -
 55
55 -
 56
56 -
 57
57 -
 58
58 -
 59
59 -
 60
60 -
 61
61 -
 62
62 -
 63
63 -
 64
64 -
 65
65 -
 66
66 -
 67
67 -
 68
68 -
 69
69 -
 70
70 -
71
-
72
 |
 |

58 TRICON GLOBAL RESTAURANTS, INC. AND SUBSIDIARIES
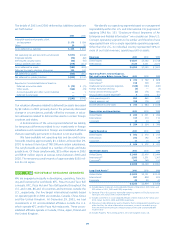
SHARE REPURCHASE PROGRAM
In February 2001, our Board of Directors authorized a share
repurchase program. This program authorizes us to repurchase,
through February 14, 2003, up to $300 million (excluding appli-
cable transaction fees) of our outstanding Common Stock.
During 2001, we repurchased approximately 2.4 million shares
for approximately $100 million at an average price per share of
approximately $42. Based on market conditions and other fac-
tors, additional repurchases may be made from time to time in
the open market or through privately negotiated transactions at
the discretion of the Company.
In 1999, our Board of Directors authorized the repurchase
of up to $350 million (excluding applicable transaction fees) of
our outstanding Common Stock. This share repurchase program
was completed in the second quarter of 2000. During 2000, we
repurchased approximately 6.4 million shares for $216 million
at an average price per share of $34. During 1999, we repur-
chased over 3.3 million shares for approximately $134 million
at an average price of $40 per share.
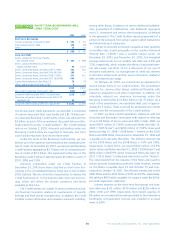
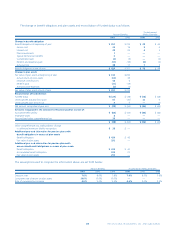
INCOME TAXES
The details of our income tax provision (benefit) are set forth
below:
2001 2000 1999
Current:
Federal $ 200 $ 215 $ 342
Foreign 75 66 46
State 38 41 39
313 322 427
Deferred:
Federal (29) (11) (18)
Foreign (33) (9) 17
State (10) (31) (15)
(72) (51) (16)
$ 241 $ 271 $ 411
Taxes payable were reduced by $13 million, $5 million and
$14 million in 2001, 2000 and 1999, respectively, as a result of
stock option exercises. In addition, goodwill and other intangi-
bles were reduced by $8 million and $2 million in 2001 and
2000, respectively, as a result of the settlement of a disputed
claim with the Internal Revenue Service relating to the
deductibility of reacquired franchise rights and other intangibles.
These reductions were offset by reductions in deferred and
accrued taxes payable.
20
NOTE
19
NOTE
In 2001, valuation allowances related to deferred tax assets
in certain states and foreign countries were reduced by $9 mil-
lion ($6 million, net of federal tax) and $6 million, respectively,
as a result of making a determination that it is more likely than
not that these assets will be utilized in the current and future
years. In 2000, valuation allowances related to deferred tax
assets in certain states and foreign countries were reduced by
$35 million ($23 million, net of federal tax) and $6 million,
respectively, as a result of making a determination that it is more
likely than not that these assets will be utilized in the current
and future years. In 1999, valuation allowances related to
deferred tax assets in certain foreign countries were reduced by
$13 million for the same reason.
The deferred foreign tax provision for 2001 included a
$2 million charge to reflect the impact of changes in statutory
tax rates in various countries. The impact of statutory rate changes
in foreign countries was less than $1 million in 2000. The 1999
deferred foreign provision included a benefit of $1 million.
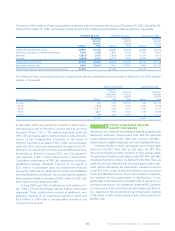
U.S. and foreign income before income taxes are set forth
below:
2001 2000 1999
U.S. $ 599 $ 537 $ 902
Foreign 134 147 136
$ 733 $ 684 $1,038
The reconciliation of income taxes calculated at the U.S. federal
tax statutory rate to our effective tax rate is set forth below:
2001 2000 1999
U.S. federal statutory rate 35.0% 35.0% 35.0%
State income tax, net of federal tax benefit 2.1 3.3 3.0
Foreign and U.S. tax effects attributable
to foreign operations 0.7 0.2 2.8
Effect of unusual items 0.1 (0.5) (0.5)
Adjustments relating to prior years (3.2) 5.5 0.8
Valuation allowance reversals (1.7) (4.2) (1.3)
Other, net (0.2) 0.3 (0.3)
Effective income tax rate 32.8% 39.6% 39.5%