Pizza Hut 2001 Annual Report Download - page 41
Download and view the complete annual report
Please find page 41 of the 2001 Pizza Hut annual report below. You can navigate through the pages in the report by either clicking on the pages listed below, or by using the keyword search tool below to find specific information within the annual report.-
 1
1 -
2
-
3
-
4
-
5
-
6
-
7
-
8
-
9
-
10
-
11
-
12
-
13
-
14
-
15
-
16
-
17
-
18
-
19
-
20
-
21
-
22
-
23
-
24
-
25
-
26
-
27
-
28
-
29
-
30
-
 31
31 -
 32
32 -
 33
33 -
 34
34 -
 35
35 -
 36
36 -
 37
37 -
 38
38 -
 39
39 -
 40
40 -
 41
41 -
 42
42 -
 43
43 -
 44
44 -
 45
45 -
 46
46 -
 47
47 -
 48
48 -
 49
49 -
 50
50 -
 51
51 -
52
-
53
-
54
-
55
-
56
-
57
-
58
-
59
-
60
-
61
-
62
-
63
-
64
-
65
-
66
-
67
-
68
-
69
-
70
-
71
-
72
 |
 |

39
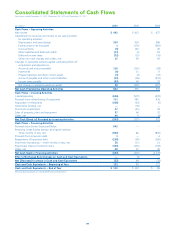
Consolidated Statements of Cash Flows
Fiscal years ended December 29, 2001, December 30, 2000 and December 25, 1999
(in millions) 2001 2000 1999
Cash Flows – Operating Activities
Net income $ 492 $ 413 $ 627
Adjustments to reconcile net income to net cash provided
by operating activities:
Depreciation and amortization 354 354 386
Facility actions net loss (gain) 1(176) (381)
Unusual items (6) 120 45
Other liabilities and deferred credits (11) (5) 65
Deferred income taxes (72) (51) (16)
Other non-cash charges and credits, net 15 43 66
Changes in operating working capital, excluding effects of
acquisitions and dispositions:
Accounts and notes receivable 116 (161) (28)
Inventories (8) 11 6
Prepaid expenses and other current assets (3) (3) (13)
Accounts payable and other current liabilities (13) (94) (215)
Income taxes payable (33) 40 23
Net change in operating working capital 59 (207) (227)
Net Cash Provided by Operating Activities 832 491 565
Cash Flows – Investing Activities
Capital spending (636) (572) (470)
Proceeds from refranchising of restaurants 111 381 916
Acquisition of restaurants (108) (24) (6)
AmeriServe funding, net —(70) —
Short-term investments 27 (21) 39
Sales of property, plant and equipment 57 64 51
Other, net 46 5 (8)
Net Cash (Used in) Provided by Investing Activities (503) (237) 522
Cash Flows – Financing Activities
Proceeds from Senior Unsecured Notes 842 ——
Revolving Credit Facility activity, by original maturity
Three months or less, net (943) 82 (860)
Proceeds from long-term debt 1—4
Repayments of long-term debt (258) (99) (180)
Short-term borrowings — three months or less, net 58 (11) 21
Repurchase shares of common stock (100) (216) (134)
Other, net 48 37 30
Net Cash Used in Financing Activities (352) (207) (1,119)
Effect of Exchange Rate Changes on Cash and Cash Equivalents —(3) —
Net (Decrease) Increase in Cash and Cash Equivalents (23) 44 (32)
Cash and Cash Equivalents – Beginning of Year 133 89 121
Cash and Cash Equivalents – End of Year $ 110 $ 133 $ 89
See accompanying Notes to Consolidated Financial Statements.