Pizza Hut 2001 Annual Report Download - page 36
Download and view the complete annual report
Please find page 36 of the 2001 Pizza Hut annual report below. You can navigate through the pages in the report by either clicking on the pages listed below, or by using the keyword search tool below to find specific information within the annual report.-
 1
1 -
2
-
3
-
4
-
5
-
6
-
7
-
8
-
9
-
10
-
11
-
12
-
13
-
14
-
15
-
16
-
17
-
18
-
19
-
20
-
21
-
22
-
23
-
24
-
25
-
 26
26 -
 27
27 -
 28
28 -
 29
29 -
 30
30 -
 31
31 -
 32
32 -
 33
33 -
 34
34 -
 35
35 -
 36
36 -
 37
37 -
 38
38 -
 39
39 -
 40
40 -
 41
41 -
 42
42 -
 43
43 -
 44
44 -
 45
45 -
 46
46 -
47
-
48
-
49
-
50
-
51
-
52
-
53
-
54
-
55
-
56
-
57
-
58
-
59
-
60
-
61
-
62
-
63
-
64
-
65
-
66
-
67
-
68
-
69
-
70
-
71
-
72
 |
 |

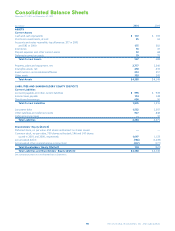
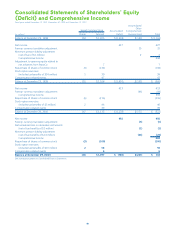
34 TRICON GLOBAL RESTAURANTS, INC. AND SUBSIDIARIES
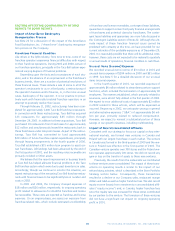
INTERNATIONAL ONGOING OPERATING PROFIT
Ongoing operating profit increased $9 million or 3%, after a
7% unfavorable impact from foreign currency translation.
Excluding the unfavorable impact of foreign currency transla-
tion and lapping the fifty-third week in 2000, ongoing operating
profit increased 12%. The increase was driven by new unit
development and same store sales growth, partially offset by
higher restaurant operating costs.
Ongoing operating profit increased $44 million or 16% in
2000, after a 2% unfavorable impact from foreign currency
translation. Excluding the unfavorable impact of foreign currency
translation and the favorable impact of the fifty-third week,
ongoing operating profit increased 16%. The increase was pri-
marily due to new unit development.
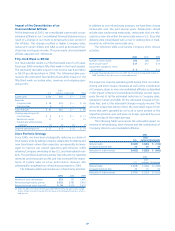
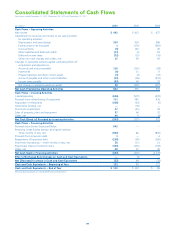
CONSOLIDATED CASH FLOWS
Net cash provided by operating activities increased
$341 million to $832 million. The increase was primarily due to
the collection of receivables established in 2000 and the absence
of the unusual charges taken in 2000 related to the AmeriServe
bankruptcy reorganization process. Excluding the AmeriServe-
related items, cash provided by operating activities was $704
million versus $734 million in 2000. See Note 22 for a discus-
sion of the AmeriServe bankruptcy reorganization process.
In 2000, net cash provided by operating activities decreased
$74 million to $491 million. The decrease was primarily due to
unusual charges related to the AmeriServe bankruptcy reor-
ganization process and the related use of working capital. The
primary driver of the net use of working capital was an increase
in receivables arising from the AmeriServe bankruptcy reorgan-
ization process, which resulted in a net use of working capital
of approximately $135 million. Excluding these AmeriServe-
related items, cash from operating activities increased by
$143 million to $734 million. This increase was driven by a lower
reduction of our working capital deficit than in 1999.
Our working capital deficit, excluding cash and cash equiv-
alents, short-term investments and short-term borrowings, is
typical of restaurant operations where a majority of sales are for
cash while payment to suppliers carry longer payment terms,
generally from 10–30 days. The lower working capital deficit
reduction in 2000 is the result of refranchising significantly fewer
restaurants in 2000 versus 1999, partially offset by a change in
payment terms in our food and supply distribution agreement
from 30 to 15 days.
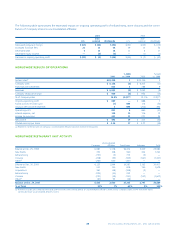
Net cash used in investing activities was $503 million
versus $237 million in 2000. The increase in cash used was pri-
marily due to lower gross refranchising proceeds as a result of
selling fewer restaurants in 2001 and increased acquisition and
capital spending. The increase was partially offset by lapping the
funding of a debtor-in-possession revolving credit facility to
AmeriServe in 2000.
In 2000, net cash used in investing activities was $237 mil-
lion versus net cash provided of $522 million in 1999. The
decline in cash flow from investing activities was primarily due
to lower gross refranchising proceeds as a result of selling fewer
restaurants to franchisees in 2000 versus 1999, increased capi-
tal spending related to development and funding of a
debtor-in-possession revolving credit facility to AmeriServe.
Although we report gross proceeds in our Consolidated
Statements of Cash Flows, we also consider refranchising pro-
ceeds on an “after-tax” basis. We define after-tax proceeds as
gross refranchising proceeds less the settlement of working cap-
ital liabilities (primarily accounts payable and property taxes)
related to the units refranchised and payment of taxes on the
gains. The after-tax proceeds can be used to pay down debt or
repurchase shares. After-tax proceeds were approximately
$90 million in 2001 which reflects a 65% decrease from 2000.
This decrease was due to the refranchising of fewer restaurants
in 2001 versus 2000. After-tax proceeds were approximately
$261 million in 2000, a 62% decrease versus 1999. This
decrease was also due to refranchising fewer restaurants in
2000 than 1999.
Net cash used in financing activities was $352 million
compared to $207 million in 2000. The increase in cash used
is primarily due to
higher repayment of
debt partially offset
by fewer shares
repurchased in 2001
compared to 2000.
In 2000, net
cash used in financ-
ing activities decreased to $207 million versus $1.1 billion in
1999 due to lower debt repayments. Less cash was available for
financing activities in 2000 due to lower cash flow from oper-
ating and investing activities, as described above.
In February 2001, our Board of Directors authorized a new
share repurchase program. This program authorizes us to repur-
chase, through February 14, 2003, up to $300 million of our
outstanding common stock (excluding applicable transaction
fees). During 2001, we repurchased approximately 2.4 million
shares for approximately $100 million. See Note 19 for a dis-
cussion of the share repurchase program.
In 1999, our Board of Directors authorized the repurchase
of up to $350 million of our outstanding common stock (exclud-
ing applicable transaction fees). This share repurchase program
was completed in 2000. During 2000, we repurchased over
6.4 million shares for approximately $216 million. See Note 19
for a discussion of the share repurchase program.
We repaid
$300 million of
debt in 2001.