Pizza Hut 2001 Annual Report Download - page 31
Download and view the complete annual report
Please find page 31 of the 2001 Pizza Hut annual report below. You can navigate through the pages in the report by either clicking on the pages listed below, or by using the keyword search tool below to find specific information within the annual report.-
 1
1 -
2
-
3
-
4
-
5
-
6
-
7
-
8
-
9
-
10
-
11
-
12
-
13
-
14
-
15
-
16
-
17
-
18
-
19
-
20
-
 21
21 -
 22
22 -
 23
23 -
 24
24 -
 25
25 -
 26
26 -
 27
27 -
 28
28 -
 29
29 -
 30
30 -
 31
31 -
 32
32 -
 33
33 -
 34
34 -
 35
35 -
 36
36 -
 37
37 -
 38
38 -
 39
39 -
 40
40 -
 41
41 -
42
-
43
-
44
-
45
-
46
-
47
-
48
-
49
-
50
-
51
-
52
-
53
-
54
-
55
-
56
-
57
-
58
-
59
-
60
-
61
-
62
-
63
-
64
-
65
-
66
-
67
-
68
-
69
-
70
-
71
-
72
 |
 |

29
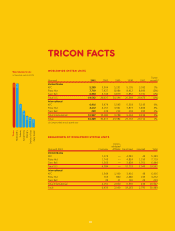
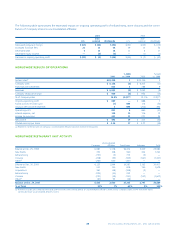
WORLDWIDE SYSTEM SALES
System sales increased approximately $169 million or 1% in
2001, after a 2% unfavorable impact from foreign currency
translation. Excluding the unfavorable impact of foreign currency
translation and lapping the fifty-third week in 2000, system sales
increased 5%. The increase was driven by new unit development
and same store sales growth, partially offset by store closures.
System sales increased $397 million or 2% in 2000, after a
1% unfavorable impact from foreign currency translation.
Excluding the unfavorable impact of foreign currency transla-
tion and the favorable impact of the fifty-third week, system sales
increased 1%. This increase was driven by new unit development,
partially offset by store closures and same store sales declines.
WORLDWIDE REVENUES
Company sales decreased $167 million or 3% in 2001, after a
2% unfavorable impact from foreign currency translation.
Excluding the unfavorable impact of foreign currency transla-
tion and lapping the fifty-third week in 2000, Company sales
were flat. An increase due to new unit development was offset
by refranchising.
Company sales decreased $794 million or 11% in 2000.
Excluding the favorable impact from the fifty-third week,
Company sales decreased 12%. The decrease was primarily
due to refranchising, store closures, the contribution of
Company stores to a new unconsolidated affiliate and same
store sales declines. This decrease was partially offset by new
unit development.
Franchise and license fees increased $27 million or 3% in
2001, after a 2% unfavorable impact from foreign currency
translation. Excluding the unfavorable impact of foreign currency
translation and lapping the fifty-third week in 2000, franchise
and license fees increased 7%. The increase was driven by new
unit development, units acquired from us and same store sales
growth. This increase was partially offset by store closures.
Franchise and license fees increased $65 million or 9% in
2000. The increase was primarily driven by units acquired from
us and new unit development partially offset by store closures
and same store sales declines in the U.S. The unfavorable impact
of foreign currency translation was essentially offset by the
favorable impact of the fifty-third week.
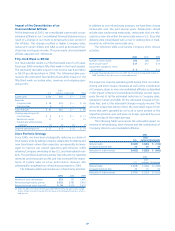
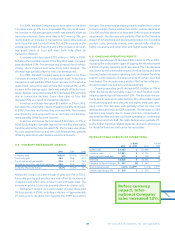
WORLDWIDE COMPANY RESTAURANT MARGIN
2001 2000 1999
Company sales 100.0% 100.0% 100.0%
Food and paper 31.1 30.8 31.5
Payroll and employee benefits 27.1 27.7 27.6
Occupancy and other operating expenses 27.0 26.4 25.5
Company restaurant margin 14.8% 15.1% 15.4%
Restaurant margin as a percentage of sales decreased approxi-
mately 30 basis points in 2001. U.S. restaurant margin was flat
and International restaurant margin declined approximately 120
basis points.
Restaurant margin as a percentage of sales decreased
approximately 25 basis points in 2000, including the unfavor-
able impact of 15 basis points from lapping the 1999 accounting
changes. U.S. restaurant margin declined approximately 55 basis
points and International restaurant margin increased approxi-
mately 65 basis points.
WORLDWIDE GENERAL AND ADMINISTRATIVE
EXPENSES
G&A decreased $34 million or 4% in 2001. Excluding the favor-
able impact of lapping the fifty-third week in 2000, G&A
decreased 3%. The decrease was driven by lower corporate and
project spending, the formation of unconsolidated affiliates and
refranchising. The decrease was partially offset by higher com-
pensation costs.
G&A decreased $65 million or 7% in 2000. Excluding the
unfavorable impact from lapping the 1999 accounting changes,
G&A decreased 9%. The decrease was primarily due to lower
incentive compensation expense and Year 2000 costs as well as
the favorable impact of refranchising and store closures. Reduced
spending on conferences also contributed to the decline. G&A
included Year 2000 spending of approximately $2 million in
2000 as compared to approximately $30 million in 1999.
WORLDWIDE FRANCHISE AND LICENSE EXPENSES
Franchise and license expenses increased $10 million or 20% in
2001. The increase was primarily due to support costs related
to the financial restructuring of certain Taco Bell franchisees. The
increase was partially offset by lower allowances for doubtful
franchise and license fee receivables.
Franchise and license expenses increased $24 million or
93% in 2000. The increase was driven by allowances for doubt-
ful franchise and license fee receivables, principally at Taco Bell.
We reduced
G&A expenses
by $34 million
in 2001.