Pizza Hut 2001 Annual Report Download - page 32
Download and view the complete annual report
Please find page 32 of the 2001 Pizza Hut annual report below. You can navigate through the pages in the report by either clicking on the pages listed below, or by using the keyword search tool below to find specific information within the annual report.-
 1
1 -
2
-
3
-
4
-
5
-
6
-
7
-
8
-
9
-
10
-
11
-
12
-
13
-
14
-
15
-
16
-
17
-
18
-
19
-
20
-
21
-
 22
22 -
 23
23 -
 24
24 -
 25
25 -
 26
26 -
 27
27 -
 28
28 -
 29
29 -
 30
30 -
 31
31 -
 32
32 -
 33
33 -
 34
34 -
 35
35 -
 36
36 -
 37
37 -
 38
38 -
 39
39 -
 40
40 -
 41
41 -
 42
42 -
43
-
44
-
45
-
46
-
47
-
48
-
49
-
50
-
51
-
52
-
53
-
54
-
55
-
56
-
57
-
58
-
59
-
60
-
61
-
62
-
63
-
64
-
65
-
66
-
67
-
68
-
69
-
70
-
71
-
72
 |
 |

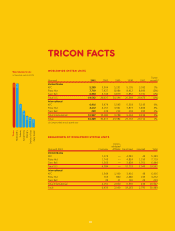
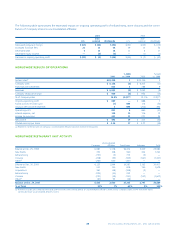
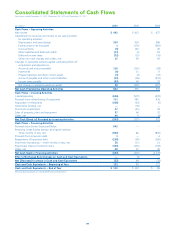
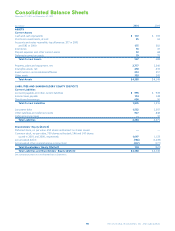
30 TRICON GLOBAL RESTAURANTS, INC. AND SUBSIDIARIES
WORLDWIDE OTHER (INCOME) EXPENSE
2001 2000 1999
Equity income $ (26) $ (25) $ (19)
Foreign exchange net loss 3—3
Other (income) expense $ (23) $ (25) $ (16)
Equity income increased $1 million or 3% in 2001, after a 6%
unfavorable impact from foreign currency translation. The
increase was driven by improved results of our unconsolidated
affiliate in the United Kingdom. The increase was offset by
equity losses from Poland and the consolidation of a previously
unconsolidated affiliate.
Equity income increased $6 million or 32% in 2000. The
increase was primarily due to improved results of our unconsol-
idated affiliates in Japan, the United Kingdom and China.
WORLDWIDE FACILITY ACTIONS NET LOSS (GAIN)
We recorded facility actions net loss of $1 million in 2001 and
facility actions net gain of $176 million in 2000 and $381 mil-
lion in 1999. See the Store Portfolio Strategy section for more
detail of our refranchising and closure activities and Note 5 for
a summary of the components of facility actions net loss (gain)
by reportable operating segment.
WORLDWIDE ONGOING OPERATING PROFIT
% B(W) % B(W)
2001 vs. 2000 2000 vs. 1999
United States $ 722 (3) $ 742 (9)
International 318 3 309 16
Unallocated and corporate
expenses (148) 9 (163) 16
Foreign exchange net loss (3) NM —NM
Ongoing operating profit $ 889 — $ 888 1
The changes in U.S. and International ongoing operating profit
for 2001 and 2000 are discussed in the respective sections.
Unallocated and corporate expenses decreased $15 million
or 9% in 2001. Excluding the favorable impact of lapping the
fifty-third week in 2000, G&A decreased 8%. The decline was
primarily due to lower corporate and project spending partially
offset by higher incentive and deferred compensation.
Excluding the unfavorable impact from lapping the 1999
accounting changes, unallocated and corporate expenses
decreased $31 million or 16% in 2000. The decline was prima-
rily due to lower Year 2000 spending and lower incentive
compensation expense.
WORLDWIDE INTEREST EXPENSE, NET
2001 2000 1999
Interest expense $ 172 $190 $ 218
Interest income (14) (14) (16)
Interest expense, net $ 158 $176 $ 202
Net interest expense decreased $18 million or 10% in 2001.
The decrease was primarily due to a decrease in our average
interest rates.
Net interest expense decreased $26 million or 13% in
2000. The decline was due to lower average debt outstanding
in 2000 as compared
to 1999, partially off-
set by an increase in
interest rates on our
variable rate debt. As
discussed in Note 22,
interest expense on
incremental borrow-
ings related to the
AmeriServe bankruptcy reorganization process of $9 million has
been included in unusual items expense in 2000.
WORLDWIDE INCOME TAXES
2001 2000 1999
Reported
Income taxes $ 241 $ 271 $ 411
Effective tax rate 32.8% 39.6% 39.5%
Ongoing(a)
Income taxes $ 243 $ 268 $ 267
Effective tax rate 33.1% 37.7% 39.3%
(a) Excludes the effects of facility actions net (loss) gain, unusual items (income)
expense and the 1999 accounting changes. See Note 5 for a discussion of these
items.
The following table reconciles the U.S. federal statutory tax rate
to our ongoing effective tax rate:
2001 2000 1999
U.S. federal statutory tax rate 35.0% 35.0% 35.0%
State income tax, net of federal tax benefit 1.9 1.8 2.3
Foreign and U.S. tax effects attributable to
foreign operations 0.2 (0.4) 4.6
Adjustments relating to prior years (2.2) 5.3 (0.7)
Valuation allowance reversals (1.7) (4.0) (2.0)
Other, net (0.1) — 0.1
Ongoing effective tax rate 33.1% 37.7% 39.3%
Net interest
expense decreased
10% in 2001.