Pizza Hut 2001 Annual Report Download - page 24
Download and view the complete annual report
Please find page 24 of the 2001 Pizza Hut annual report below. You can navigate through the pages in the report by either clicking on the pages listed below, or by using the keyword search tool below to find specific information within the annual report.-
 1
1 -
2
-
3
-
4
-
5
-
6
-
7
-
8
-
9
-
10
-
11
-
12
-
13
-
 14
14 -
 15
15 -
 16
16 -
 17
17 -
 18
18 -
 19
19 -
 20
20 -
 21
21 -
 22
22 -
 23
23 -
 24
24 -
 25
25 -
 26
26 -
 27
27 -
 28
28 -
 29
29 -
 30
30 -
 31
31 -
 32
32 -
 33
33 -
 34
34 -
35
-
36
-
37
-
38
-
39
-
40
-
41
-
42
-
43
-
44
-
45
-
46
-
47
-
48
-
49
-
50
-
51
-
52
-
53
-
54
-
55
-
56
-
57
-
58
-
59
-
60
-
61
-
62
-
63
-
64
-
65
-
66
-
67
-
68
-
69
-
70
-
71
-
72
 |
 |

22
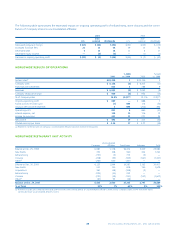
WORLDWIDE SYSTEM UNITS
5-year
Year-end 2001 2000 1999 1998 1997 growth(a)
United States
KFC 5,399 5,364 5,231 5,105 5,092 1%
Pizza Hut 7,719 7,927 8,084 8,412 8,640 (2%)
Taco Bell 6,444 6,746 6,879 6,852 6,741 (1%)
Total U.S. 19,562 20,037 20,194 20,369 20,473 (1%)
International
KFC 6,416 5,974 5,595 5,318 5,145 6%
Pizza Hut 4,272 4,157 3,961 3,873 3,894 3%
Taco Bell 239 249 232 203 200 3%
Total International 10,927 10,380 9,788 9,394 9,239 5%
Total 30,489 30,417 29,982 29,763 29,712 1%
(a) Compounded annual growth rate
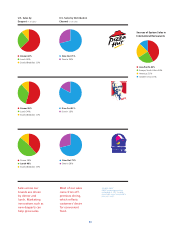
BREAKDOWN OF WORLDWIDE SYSTEM UNITS
Uncon-
solidated
Year-end 2001 Company Affiliate Franchised Licensed Total
United States
KFC 1,274 — 4,081 44 5,399
Pizza Hut 1,745 — 4,824 1,150 7,719
Taco Bell 1,265 — 3,828 1,351 6,444
Total U.S . 4,284 — 12,733 2,545 19,562
International
KFC 1,349 1,109 3,910 48 6,416
Pizza Hut 763 860 2,480 169 4,272
Taco Bell 39 31 140 29 239
Total International 2,151 2,000 6,530 246 10,927
Total 6,435 2,000 19,263 2,791 30,489
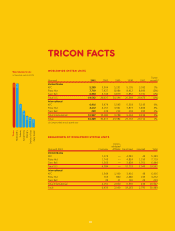
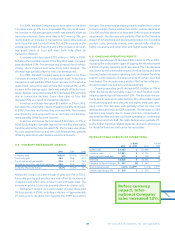
TRICON FACTS
Worldwide Units
In thousands, year-end 2001
Tricon
McDonald’s
Subway
Burger King
Wendy’s
Domino’s Pizza
Dairy Queen
6
30.5
30.1
16.1
11.7
8.2
7.1
5.9