Pizza Hut 2001 Annual Report Download - page 34
Download and view the complete annual report
Please find page 34 of the 2001 Pizza Hut annual report below. You can navigate through the pages in the report by either clicking on the pages listed below, or by using the keyword search tool below to find specific information within the annual report.-
 1
1 -
2
-
3
-
4
-
5
-
6
-
7
-
8
-
9
-
10
-
11
-
12
-
13
-
14
-
15
-
16
-
17
-
18
-
19
-
20
-
21
-
22
-
23
-
 24
24 -
 25
25 -
 26
26 -
 27
27 -
 28
28 -
 29
29 -
 30
30 -
 31
31 -
 32
32 -
 33
33 -
 34
34 -
 35
35 -
 36
36 -
 37
37 -
 38
38 -
 39
39 -
 40
40 -
 41
41 -
 42
42 -
 43
43 -
 44
44 -
45
-
46
-
47
-
48
-
49
-
50
-
51
-
52
-
53
-
54
-
55
-
56
-
57
-
58
-
59
-
60
-
61
-
62
-
63
-
64
-
65
-
66
-
67
-
68
-
69
-
70
-
71
-
72
 |
 |

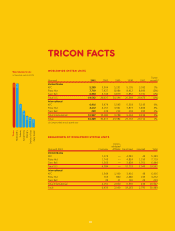
32 TRICON GLOBAL RESTAURANTS, INC. AND SUBSIDIARIES
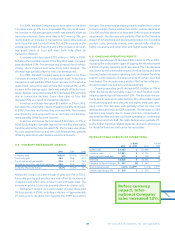
For 2001, blended Company same store sales for our three
Concepts were up 1% on a comparable fifty-two week basis.
An increase in the average guest check was partially offset by
transaction declines. Same store sales at KFC were up 3%, pri-
marily due to an increase in transactions. Same store sales at
both Pizza Hut and Taco Bell were flat. A 2% increase in the
average guest check at Pizza Hut and a 3% increase in the aver-
age guest check at Taco Bell were both fully offset by
transaction declines.
Company sales decreased $720 million or 14% in 2000.
Excluding the favorable impact of the fifty-third week, Company
sales decreased 15%. The decrease was primarily due to refran-
chising, store closures and same store sales declines. The
decrease was partially offset by new unit development.
For 2000, blended Company same store sales for our three
Concepts decreased 2% on a comparable basis. A decline in
transactions was partially offset by an increase in the average
guest check. Same store sales at Pizza Hut increased 1%. A 3%
increase in the average guest check was partially offset by trans-
action declines. Same store sales at KFC decreased 3%, primarily
due to transaction declines. Same store sales at Taco Bell
decreased 5% as a result of transaction declines.
Franchise and license fees grew $11 million or 2% in 2001.
Excluding the unfavorable impact of lapping the fifty-third week
in 2000, franchise and license fees increased 4%. The increase
was driven by units acquired from us and new unit develop-
ment, partially offset by store closures.
Franchise and license fees increased $34 million or 7% in
2000. Excluding the favorable impact from the fifty-third week,
franchise and license fees increased 5%. The increase was driven
by units acquired from us and new unit development, partially
offset by same store sales declines and store closures.
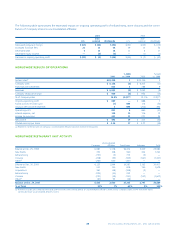
U.S. COMPANY RESTAURANT MARGIN
2001 2000 1999
Company sales 100.0% 100.0% 100.0%
Food and paper 28.6 28.6 30.0
Payroll and employee benefits 30.6 30.8 29.8
Occupancy and other operating expenses 25.6 25.4 24.5
Company restaurant margin 15.2% 15.2% 15.7%
Restaurant margin as a percentage of sales was flat in 2001.
Favorable pricing and product mix was offset by increases in
occupancy and other costs, product costs and wage rates. The
increase in product costs was primarily driven by cheese costs.
Restaurant margin as a percentage of sales decreased
55 basis points in 2000, including a decline of approximately
25 basis points resulting from lapping the 1999 accounting
changes. The remaining decrease primarily resulted from a shift
to lower margin chicken sandwiches at KFC, volume declines at
Taco Bell and the absence of favorable 1999 insurance-related
adjustments. The decrease was partially offset by the favorable
impact of refranchising and pricing and product mix. Favorable
product costs, primarily cheese, were almost fully offset by
higher occupancy and other costs and higher wage rates.
U.S. ONGOING OPERATING PROFIT
Ongoing operating profit decreased $20 million or 3% in 2001.
Excluding the unfavorable impact of lapping the fifty-third week
in 2000, ongoing operating profit decreased 1%. The decrease
was driven by the unfavorable impact of refranchising and store
closures, higher restaurant operating costs and higher franchise
support costs related to the restructuring of certain Taco Bell
franchisees. The decrease was partially offset by favorable pric-
ing and product mix and new unit development.
Ongoing operating profit decreased $71 million or 9% in
2000. Excluding the favorable impact of the fifty-third week,
ongoing operating profit decreased 12%. The decrease was pri-
marily due to same store sales declines, the unfavorable impact
of refranchising and store closures and higher restaurant oper-
ating costs. The decrease was partially offset by new unit
development and reduced G&A expenses. The decrease in G&A
expenses was largely due to lower incentive compensation,
decreased professional fees and lower spending on conferences
at Pizza Hut and Taco Bell. The G&A declines were partially off-
set by higher franchise-related expenses, primarily allowances
for doubtful franchise and license fee receivables.
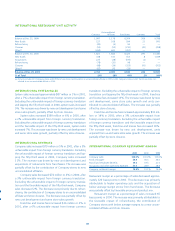
INTERNATIONAL RESULTS OF OPERATIONS
% B(W) % B(W)
2001 vs. 2000 2000 vs. 1999
System sales $ 7,732 1 $ 7,645 6
Company sales $ 1,851 5 $ 1,772 (4)
Franchise and license fees 275 6 259 14
Revenues $ 2,126 5 $ 2,031 (2)
Company restaurant margin $ 257 (4) $ 267 —
% of Company sales 13.9% (1.2)ppts. 15.1% 0.7ppts.
Ongoing operating profit $ 318 3 $ 309 16
Before currency
impact, Inter-
national Company
sales increased 10%.