Pizza Hut 2001 Annual Report Download - page 30
Download and view the complete annual report
Please find page 30 of the 2001 Pizza Hut annual report below. You can navigate through the pages in the report by either clicking on the pages listed below, or by using the keyword search tool below to find specific information within the annual report.-
 1
1 -
2
-
3
-
4
-
5
-
6
-
7
-
8
-
9
-
10
-
11
-
12
-
13
-
14
-
15
-
16
-
17
-
18
-
19
-
 20
20 -
 21
21 -
 22
22 -
 23
23 -
 24
24 -
 25
25 -
 26
26 -
 27
27 -
 28
28 -
 29
29 -
 30
30 -
 31
31 -
 32
32 -
 33
33 -
 34
34 -
 35
35 -
 36
36 -
 37
37 -
 38
38 -
 39
39 -
 40
40 -
41
-
42
-
43
-
44
-
45
-
46
-
47
-
48
-
49
-
50
-
51
-
52
-
53
-
54
-
55
-
56
-
57
-
58
-
59
-
60
-
61
-
62
-
63
-
64
-
65
-
66
-
67
-
68
-
69
-
70
-
71
-
72
 |
 |

28 TRICON GLOBAL RESTAURANTS, INC. AND SUBSIDIARIES
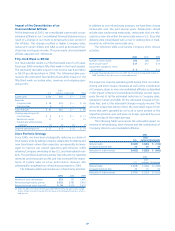
The following table summarizes the estimated impact on ongoing operating profit of refranchising, store closures and the contri-
bution of Company stores to unconsolidated affiliates:
2001 2000
Inter- Inter-
U.S. national Worldwide U.S. national Worldwide
Decreased restaurant margin $ (67) $ (25) $ (92) $ (90) $ (25) $ (115)
Increased franchise fees 21 13 34 39 13 52
Decreased G&A 5131811 6 17
Decreased equity income — (5) (5) — (1) (1)
Decrease in ongoing operating profit $ (41) $ (4) $ (45) $ (40) $ (7) $ (47)
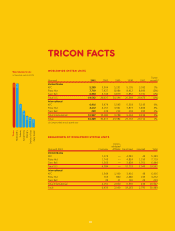
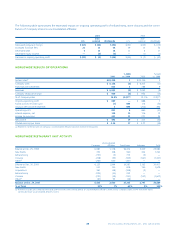
WORLDWIDE RESULTS OF OPERATIONS
% B(W) % B(W)
2001 vs. 2000 2000 vs. 1999
System sales(a) $ 22,328 1 $ 22,159 2
Company sales $ 6,138 (3) $ 6,305 (11)
Franchise and license fees 815 3 788 9
Revenues $ 6,953 (2) $ 7,093 (9)
Company restaurant margin $ 906 (5) $ 954 (13)
% of Company sales 14.8% (0.3)ppts. 15.1% (0.3)ppts.
Ongoing operating profit $ 889 — $ 888 1
Facility actions net (loss) gain (1) NM 176 (54)
Unusual items income (expense) 3NM(204) NM
Operating profit 891 4 860 (31)
Interest expense, net 158 10 176 13
Income tax provision 241 11 271 34
Net income $ 492 19 $ 413 (34)
Diluted earnings per share $ 3.24 17 $ 2.77 (29)
(a) Represents combined sales of Company, unconsolidated affiliate, franchise and license restaurants.
WORLDWIDE RESTAURANT UNIT ACTIVITY
Unconsolidated
Company Affiliates Franchisees Licensees Total
Balance at Dec. 25, 1999 6,981 1,178 18,414 3,409 29,982
New Builds 370 108 960 324 1,762
Refranchising (757) (9) 775 (9) —
Closures (208) (53) (505) (561) (1,327)
Other(a) (263) 620 (357) — —
Balance at Dec. 30, 2000 6,123 1,844 19,287 3,163 30,417
New Builds 521 150 818 190 1,679
Acquisitions 361 (28) (328) (5) —
Refranchising (233) (20) 253 — —
Closures (270) (39) (741) (557) (1,607)
Other(a) (67) 93 (26) — —
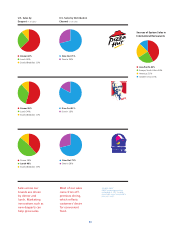
Balance at Dec. 29, 2001 6,435 2,000 19,263 2,791 30,489
% of Total 21% 7% 63% 9% 100%
(a) Primarily includes 320 Company stores and 329 franchisee stores contributed to an unconsolidated affiliate in 2000 and 52 Company stores and 41 franchisee stores
contributed to an unconsolidated affiliate in 2001.