Pizza Hut 2001 Annual Report Download - page 33
Download and view the complete annual report
Please find page 33 of the 2001 Pizza Hut annual report below. You can navigate through the pages in the report by either clicking on the pages listed below, or by using the keyword search tool below to find specific information within the annual report.-
 1
1 -
2
-
3
-
4
-
5
-
6
-
7
-
8
-
9
-
10
-
11
-
12
-
13
-
14
-
15
-
16
-
17
-
18
-
19
-
20
-
21
-
22
-
 23
23 -
 24
24 -
 25
25 -
 26
26 -
 27
27 -
 28
28 -
 29
29 -
 30
30 -
 31
31 -
 32
32 -
 33
33 -
 34
34 -
 35
35 -
 36
36 -
 37
37 -
 38
38 -
 39
39 -
 40
40 -
 41
41 -
 42
42 -
 43
43 -
44
-
45
-
46
-
47
-
48
-
49
-
50
-
51
-
52
-
53
-
54
-
55
-
56
-
57
-
58
-
59
-
60
-
61
-
62
-
63
-
64
-
65
-
66
-
67
-
68
-
69
-
70
-
71
-
72
 |
 |

31
The 2001 ongoing effective tax rate decreased 4.6 percentage
points to 33.1%. The decrease in the ongoing effective tax rate
was primarily due to adjustments related to prior years, partially
offset by reduced valuation allowance reversals. See Note 20 for
a discussion of valuation allowances.
In 2001, the effective tax rate attributable to foreign oper-
ations was slightly higher than the U.S. federal statutory rate
because losses of foreign operations for which no benefit could
be currently recognized and other adjustments more than off-
set the effect of claiming credit against our U.S. income tax
liability for foreign taxes paid.
The 2000 ongoing effective tax rate decreased 1.6 per-
centage points to 37.7%. The decrease in the ongoing effective
tax rate was primarily due to a reduction in the tax on our inter-
national operations, including the initial benefits of becoming
eligible in 2000 to claim substantially all of our available foreign
income tax credits for foreign taxes paid in 2000 against our
U.S. income tax liability, and incremental valuation allowance
reversals. This decrease was partially offset by adjustments relat-
ing to prior years.
In 2000, the effective tax rate attributable to foreign oper-
ations was lower than the U.S. federal statutory rate due to our
ability to claim credit against our U.S. income tax liability for
foreign taxes paid. The effective tax rate attributable to foreign
operations in 1999 was higher than the U.S. federal statutory
tax rate. This was primarily due to foreign tax rate differentials,
including foreign withholding tax paid without benefit of the
related foreign tax credit for U.S. income tax purposes and
losses of foreign operations for which no tax benefit could be
currently recognized.
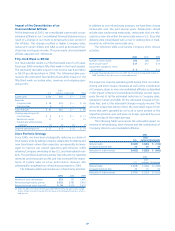
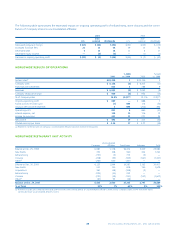
EARNINGS PER SHARE
The components of earnings per common share (“EPS”) were
as follows:
2001(a) 2000(a)
Diluted Basic Diluted Basic
Ongoing operating earnings $ 3.21 $ 3.33 $ 2.98 $ 3.02
Facility actions net gain 0.02 0.02 0.66 0.67
Unusual items 0.01 0.01 (0.87) (0.88)
Net income $ 3.24 $ 3.36 $ 2.77 $ 2.81
(a) See Note 4 for the number of shares used in these calculations.
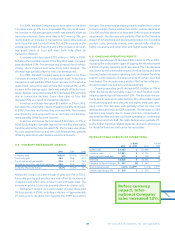
U.S. RESULTS OF OPERATIONS
% B(W) % B(W)
2001 vs. 2000 2000 vs. 1999
System sales $14,596 1 $ 14,514 —
Company sales $ 4,287 (5) $ 4,533 (14)
Franchise and license fees 540 2 529 7
Revenues $ 4,827 (5) $ 5,062 (12)
Company restaurant margin $ 649 (5) $ 687 (17)
% of Company sales 15.2% — 15.2% (0.5)ppts.
Ongoing operating profit $ 722 (3) $ 742 (9)
U.S. RESTAURANT UNIT ACTIVITY
Company Franchisees Licensees Total
Balance at Dec. 25, 1999 4,984 12,110 3,100 20,194
New Builds 143 366 303 812
Refranchising (672) 681 (9) —
Closures (153) (295) (521) (969)
Balance at Dec. 30, 2000 4,302 12,862 2,873 20,037
New Builds 183 265 182 630
Acquisitions 136 (133) (3) —
Refranchising (155) 155 — —
Closures (182) (416) (507) (1,105)
Balance at Dec. 29, 2001 4,284 12,733 2,545 19,562
% of Total 22% 65% 13% 100%
U.S. SYSTEM SALES
System sales increased $82 million or 1% in 2001. Excluding the
unfavorable impact of lapping the fifty-third week in 2000, sys-
tem sales increased 2%. The increase was driven by new unit
development and same store sales growth at KFC and Pizza Hut,
partially offset by store closures.
System sales were flat in 2000. Excluding the favorable impact
of the fifty-third week, system sales decreased 2%. The decrease
was due to same stores sales declines at Taco Bell and KFC as
well as store closures, partially offset by new unit development.
U.S. REVENUES
Company sales decreased $246 million or 5% in 2001.
Excluding the unfavorable impact of lapping the fifty-third week
in 2000, Company sales decreased 4%. The decrease was driven
by refranchising, partially offset by new unit development.
Ongoing
operating EPS
increased 8%.