Pentax 2009 Annual Report Download - page 85
Download and view the complete annual report
Please find page 85 of the 2009 Pentax annual report below. You can navigate through the pages in the report by either clicking on the pages listed below, or by using the keyword search tool below to find specific information within the annual report.-
 1
1 -
2
-
3
-
4
-
5
-
6
-
7
-
8
-
9
-
10
-
11
-
12
-
13
-
14
-
15
-
16
-
17
-
18
-
19
-
20
-
21
-
22
-
23
-
24
-
25
-
26
-
27
-
28
-
29
-
30
-
31
-
32
-
33
-
34
-
35
-
36
-
37
-
38
-
39
-
40
-
41
-
42
-
43
-
44
-
45
-
46
-
47
-
48
-
49
-
50
-
51
-
52
-
53
-
54
-
55
-
56
-
57
-
58
-
59
-
60
-
61
-
62
-
63
-
64
-
65
-
66
-
67
-
68
-
69
-
70
-
71
-
72
-
73
-
74
-
 75
75 -
 76
76 -
 77
77 -
 78
78 -
 79
79 -
 80
80 -
 81
81 -
 82
82 -
 83
83 -
 84
84 -
 85
85 -
 86
86 -
 87
87 -
 88
88 -
 89
89 -
 90
90 -
 91
91 -
 92
92 -
 93
93 -
 94
94
 |
 |
83
HOYA Annual Report 2009
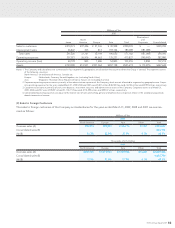
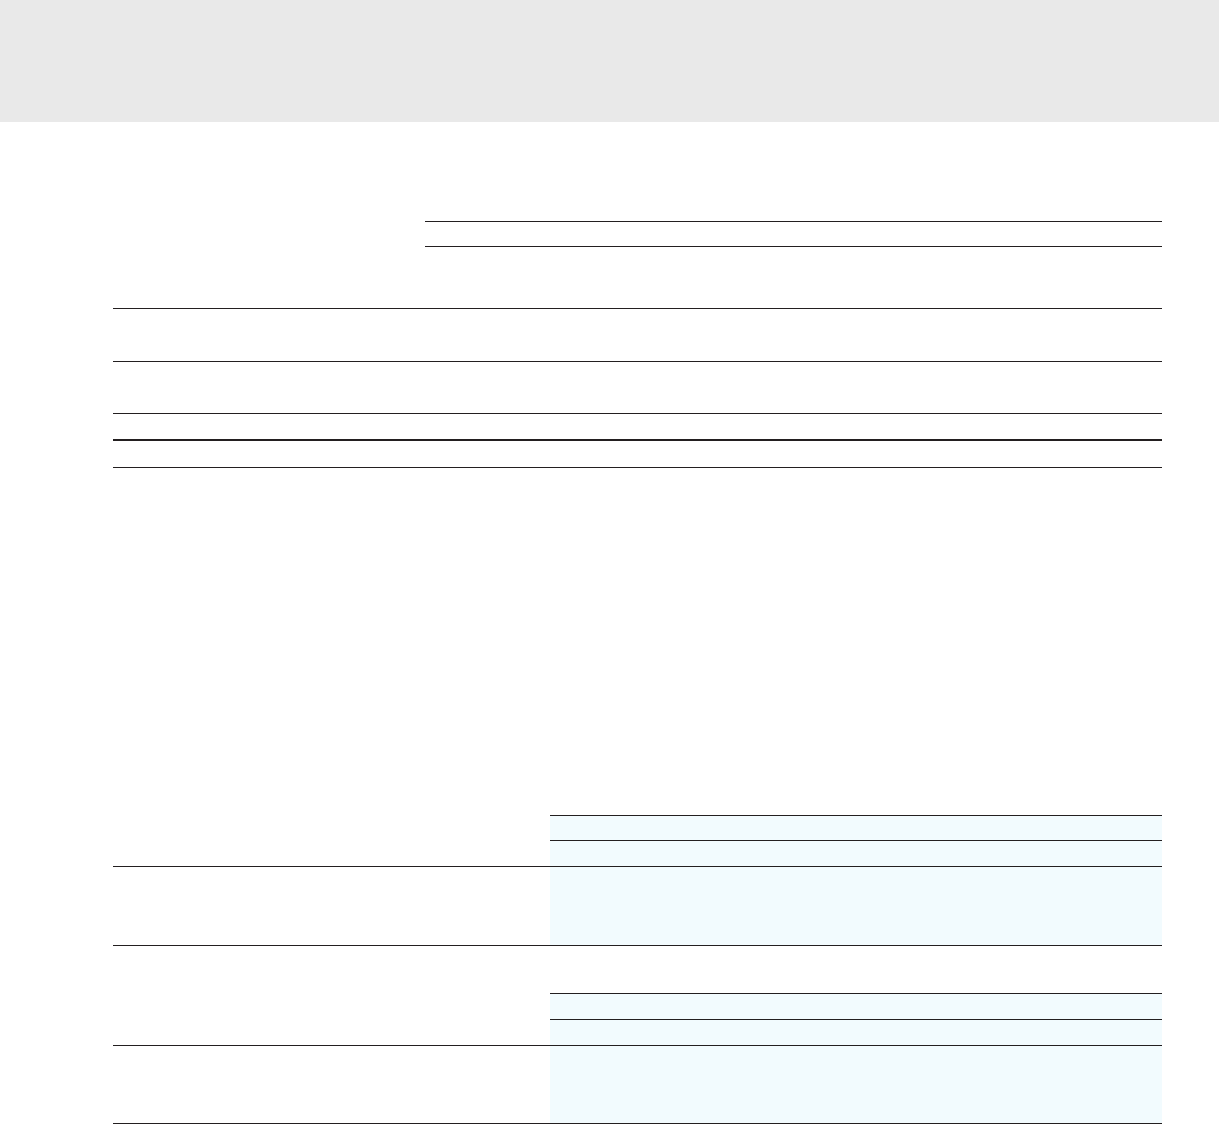
Millions of Yen
2007
Japan
North
America Europe Asia Total
Eliminations
and
Corporate Consolidated
Sales to customers ¥270,373 ¥37,456 ¥ 51,336 ¥ 30,928 ¥390,093 ¥ — ¥390,093
Intersegment sales 26,847 305 813 159,124 187,089 (187,089) —
Total sales 297,220 37,761 52,149 190,052 577,182 (187,089) 390,093
Operating expenses 257,021 36,916 44,663 135,227 473,827 (190,947) 282,880
Operating income (loss) 40,199 845 7,486 54,825 103,355 3,858 107,213
Assets ¥193,390 ¥13,507 ¥107,564 ¥207,158 ¥521,619 ¥ (73,975) ¥447,644
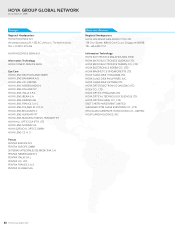
Notes: 1. The Company and subsidiaries are summarized in four segments by geographic area based on the countries where the Group is located. The segments consist
of the following countries:
North America: United States of America, Canada, etc.
Europe: Netherlands, Germany, United Kingdom, etc. (including South Africa)
Asia: Singapore, Thailand, China, Republic of Korea, Taiwan, etc. (including Australia)
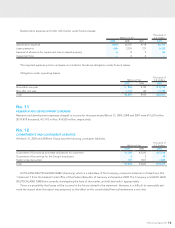
2. Corporate operating expenses consist primarily of the administration expenses of the Company, which are not allocated to segments by geographic area. Corpo-
rate operating expenses for the years ended March 31, 2009, 2008 and 2007 were ¥3,807 million ($38,753 thousand), ¥4,142 million and ¥2,993 million, respectively.
3. Corporate assets consist primarily of cash, time deposits, investment securities and administrative assets of the Company. Corporate assets as of March 31,
2009, 2008 and 2007 were ¥109,897 million ($1,118,773 thousand), ¥115,499 million and ¥59,047 million, respectively.
4. Consolidated operating expenses are equal to the total of cost of sales and selling, general and administrative expenses shown in the accompanying consoli-
dated statements of income.
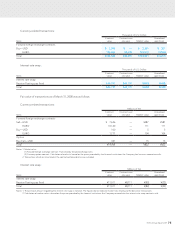
(3) Sales to Foreign Customers
The sales to foreign customers of the Company and subsidiaries for the years ended March 31, 2009, 2008 and 2007 are summa-
rized as follows:
Millions of Yen
2009
North America Europe Asia Other Total
Overseas sales (A) ¥55,915 ¥99,800 ¥126,716 ¥1,401 ¥283,832
Consolidated sales (B) 454,195
(A)/(B) 12.3% 22.0% 27.9% 0.3% 62.5%
Thousands of U.S. Dollars
2009
North America Europe Asia Other Total
Overseas sales (A) $569,225 $1,015,984 $1,289,996 $14,261 $2,889,466
Consolidated sales (B) 4,623,790
(A)/(B) 12.3% 22.0% 27.9% 0.3% 62.5%