Pentax 2009 Annual Report Download - page 46
Download and view the complete annual report
Please find page 46 of the 2009 Pentax annual report below. You can navigate through the pages in the report by either clicking on the pages listed below, or by using the keyword search tool below to find specific information within the annual report.-
 1
1 -
2
-
3
-
4
-
5
-
6
-
7
-
8
-
9
-
10
-
11
-
12
-
13
-
14
-
15
-
16
-
17
-
18
-
19
-
20
-
21
-
22
-
23
-
24
-
25
-
26
-
27
-
28
-
29
-
30
-
31
-
32
-
33
-
34
-
35
-
 36
36 -
 37
37 -
 38
38 -
 39
39 -
 40
40 -
 41
41 -
 42
42 -
 43
43 -
 44
44 -
 45
45 -
 46
46 -
 47
47 -
 48
48 -
 49
49 -
 50
50 -
 51
51 -
 52
52 -
 53
53 -
 54
54 -
 55
55 -
 56
56 -
57
-
58
-
59
-
60
-
61
-
62
-
63
-
64
-
65
-
66
-
67
-
68
-
69
-
70
-
71
-
72
-
73
-
74
-
75
-
76
-
77
-
78
-
79
-
80
-
81
-
82
-
83
-
84
-
85
-
86
-
87
-
88
-
89
-
90
-
91
-
92
-
93
-
94
 |
 |
0
30,000
60,000
90,000
120,000
150,000
–30,000
–20,000
–10,000
0
10,000
20,000
30,000
–40
–20
0
20
40
44 HOYA Annual Report 2009
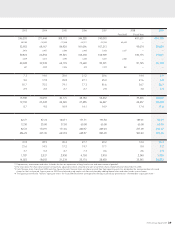
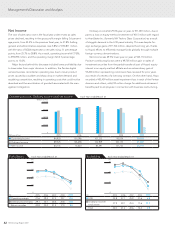
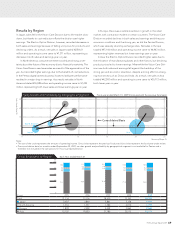
Quarterly Financial Data
Quarterly Net Sales Each Year ended March 31
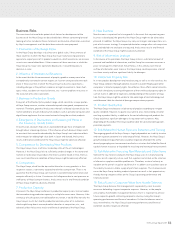
Quarterly Operating Income, Ordinary Income and Net Income Each Year ended March 31
(Millions of Yen)
(Millions of Yen)
1Q
1Q
2Q
2Q
3Q
3Q
4Q
4Q
1Q
1Q
2Q
2Q
3Q
3Q
4Q
4Q
(Millions of Yen) 2008 2009
Net Sales 97,779 100,980 147,055 135,816 130,157 128,372 112,741 82,925
(Millions of Yen) 2008 2009
n Operating Income 22,640 26,850 27,525 18,059 21,858 20,611 16,687 –61
n Ordinary Income 23,976 28,120 28,171 19,908 22,473 27,511 18,277 2,820
n Net Income 17,097 21,021 22,603 21,004 21,198 19,136 12,610 –27,834
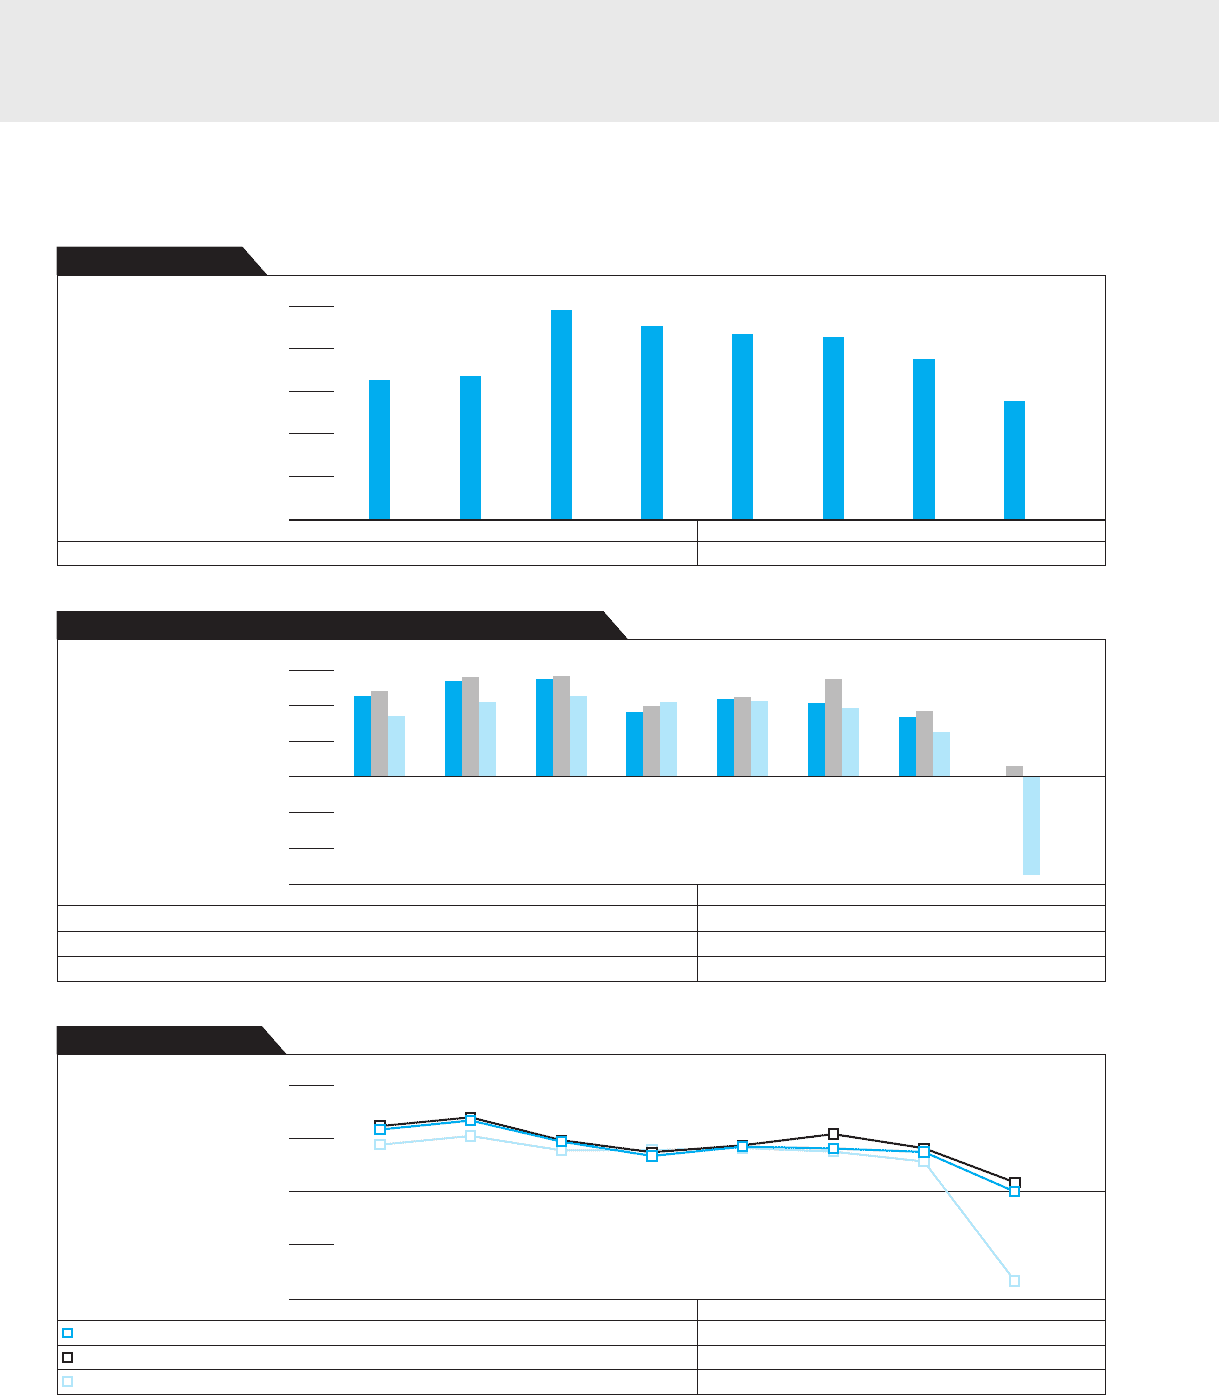
Quarterly Profit Ratios Each Year ended March 31
(%) 1Q 2Q 3Q 4Q 1Q 2Q 3Q 4Q
(%) 2008 2009
Operating margin 23.2 26.6 18.7 13.3 16.8 16.1 14.8 –0.1
Ordinary income ratio 24.5 27.8 19.2 14.7 17.3 21.5 16.2 3.4
Return on sales 17.5 20.8 15.4 15.5 16.3 14.9 11.2 –33.6
Management’s Discussion and Analysis