Pentax 2009 Annual Report Download - page 41
Download and view the complete annual report
Please find page 41 of the 2009 Pentax annual report below. You can navigate through the pages in the report by either clicking on the pages listed below, or by using the keyword search tool below to find specific information within the annual report.-
 1
1 -
2
-
3
-
4
-
5
-
6
-
7
-
8
-
9
-
10
-
11
-
12
-
13
-
14
-
15
-
16
-
17
-
18
-
19
-
20
-
21
-
22
-
23
-
24
-
25
-
26
-
27
-
28
-
29
-
30
-
 31
31 -
 32
32 -
 33
33 -
 34
34 -
 35
35 -
 36
36 -
 37
37 -
 38
38 -
 39
39 -
 40
40 -
 41
41 -
 42
42 -
 43
43 -
 44
44 -
 45
45 -
 46
46 -
 47
47 -
 48
48 -
 49
49 -
 50
50 -
 51
51 -
52
-
53
-
54
-
55
-
56
-
57
-
58
-
59
-
60
-
61
-
62
-
63
-
64
-
65
-
66
-
67
-
68
-
69
-
70
-
71
-
72
-
73
-
74
-
75
-
76
-
77
-
78
-
79
-
80
-
81
-
82
-
83
-
84
-
85
-
86
-
87
-
88
-
89
-
90
-
91
-
92
-
93
-
94
 |
 |

39
HOYA Annual Report 2009
2003 2004 2005 2006 2007 2008 2009
First Half Fiscal Year
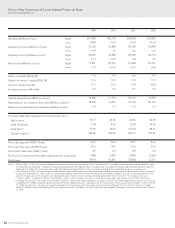
246,293 271,444 308,172 344,228 390,093 481,631 454,195
108,189 134,493 133,558 142,211 157,344 85,689 — —
52,983 68,167 84,920 101,096 107,213 95,074 59,095
3,970 6,937 3,586 2,985 5,653 3,337 —
—
50,874 66,554 89,525 103,638 102,909 100,175 71,081
3,639 5,375 3,396 3,260 5,067 2,820 —
—
20,038 39,549 64,135 75,620 83,391 81,725 25,110
687 3,089 3,526 805 3,570 586 —
—
7.3 14.0 20.0 21.2 20.6 14.4 3.9
9.0 17.8 25.8 27.1 25.9 21.6 6.9
81.7 75.5 79.1 77.3 81.6 56.7 56.7
2.9 2.8 2.7 2.7 2.8 3.0 3.5
15,948 30,659 40,175 48,786 54,432 39,465 34,839
19,792 25,328 22,520 27,485 36,427 45,457 80,490
8.7 9.8 10.9 14.1 14.9 17.4 17.6
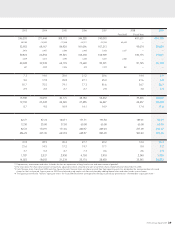
42.77 87.74 144.71 171.71 193.50 189.01 58.01
12.50 25.00 37.50 60.00 65.00 65.00 65.00
82.72 174.91 171.65 240.57 229.23 277.09 210.17
486.29 491.90 623.59 648.87 845.98 903.49 774.65
41.8 28.9 20.4 27.7 20.2 12.4 33.3
21.6 14.5 17.2 19.7 17.1 8.4 9.2
3.7 5.2 4.7 7.3 4.6 2.6 2.5
1,787 2,537 2,950 4,750 3,910 2,340 1,930
14,023 18,092 21,234 25,176 28,450 35,545 34,592
*1 Depreciation, amortization and other: Includes the loss on impairment of long-lived assets and amortization of goodwill.
*2 Per share data: Per share data has been retroactively adjusted to reflect a four-for-one split of common shares implemented on November 15, 2005.
*3 Cash flow per share: From fiscal 2002 and after, figures for cash flow per share are shown as cash flow from operating activities divided by the average number of issued
shares for the fiscal period. Figures prior to 2002 are calculated using simple cash flow calculated by adding depreciation and other factors to net income.
*4 The figures presented for “owners’ equity per share” for fiscal 2006 and earlier correspond to the figures previously presented as “shareholders’ equity per share.”