Pentax 2009 Annual Report Download - page 84
Download and view the complete annual report
Please find page 84 of the 2009 Pentax annual report below. You can navigate through the pages in the report by either clicking on the pages listed below, or by using the keyword search tool below to find specific information within the annual report.-
 1
1 -
2
-
3
-
4
-
5
-
6
-
7
-
8
-
9
-
10
-
11
-
12
-
13
-
14
-
15
-
16
-
17
-
18
-
19
-
20
-
21
-
22
-
23
-
24
-
25
-
26
-
27
-
28
-
29
-
30
-
31
-
32
-
33
-
34
-
35
-
36
-
37
-
38
-
39
-
40
-
41
-
42
-
43
-
44
-
45
-
46
-
47
-
48
-
49
-
50
-
51
-
52
-
53
-
54
-
55
-
56
-
57
-
58
-
59
-
60
-
61
-
62
-
63
-
64
-
65
-
66
-
67
-
68
-
69
-
70
-
71
-
72
-
73
-
 74
74 -
 75
75 -
 76
76 -
 77
77 -
 78
78 -
 79
79 -
 80
80 -
 81
81 -
 82
82 -
 83
83 -
 84
84 -
 85
85 -
 86
86 -
 87
87 -
 88
88 -
 89
89 -
 90
90 -
 91
91 -
 92
92 -
 93
93 -
 94
94
 |
 |

82 HOYA Annual Report 2009
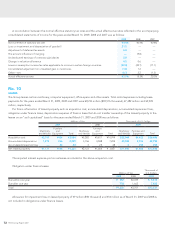
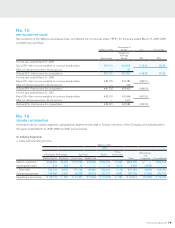
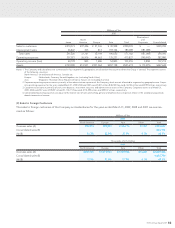
(2) Geographical Segments
The geographical segments of the Company and subsidiaries for the years ended March 31, 2009, 2008 and 2007 are summarized
as follows:
Millions of Yen
2009
Japan
North
America Europe Asia Total
Eliminations
and
Corporate Consolidated
Sales to customers ¥259,631 ¥55,028 ¥97,144 ¥ 42,392 ¥454,195 ¥ — ¥454,195
Intersegment sales 52,496 707 889 135,030 189,122 (189,122) —
Total sales 312,127 55,735 98,033 177,422 643,317 (189,122) 454,195
Operating expenses 304,756 54,510 93,090 141,650 594,006 (198,906) 395,100
Operating income (loss) 7,371 1,225 4,943 35,772 49,311 9,784 59,095
Assets ¥249,701 ¥33,681 ¥64,607 ¥217,187 ¥565,176 ¥ 25,920 ¥591,096
Thousands of U.S. Dollars
2009
Japan
North
America Europe Asia Total
Eliminations
and
Corporate Consolidated
Sales to customers $2,643,090 $560,196 $988,946 $ 431,558 $4,623,790 $ — $4,623,790
Intersegment sales 534,421 7,199 9,053 1,374,628 1,925,301 (1,925,301) —
Total sales 3,177,511 567,395 997,999 1,806,186 6,549,091 (1,925,301) 4,623,790
Operating expenses 3,102,470 554,922 947,680 1,442,019 6,047,091 (2,024,899) 4,022,192
Operating income (loss) 75,041 12,473 50,319 364,167 502,000 99,598 601,598
Assets $2,542,006 $342,878 $657,710 $2,211,004 $5,753,598 $ 263,876 $6,017,474
Millions of Yen
2008
Japan
North
America Europe Asia Total
Eliminations
and
Corporate Consolidated
Sales to customers ¥291,566 ¥56,680 ¥89,420 ¥ 43,965 ¥481,631 ¥ — ¥481,631
Intersegment sales 54,012 374 757 157,230 212,373 (212,373) —
Total sales 345,578 57,054 90,177 201,195 694,004 (212,373) 481,631
Operating expenses 315,421 51,788 83,359 157,360 607,928 (221,371) 386,557
Operating income (loss) 30,157 5,266 6,818 43,835 86,076 8,998 95,074
Assets ¥333,040 ¥37,722 ¥66,642 ¥228,174 ¥665,578 ¥ 23,866 ¥689,444