Pentax 2009 Annual Report Download - page 62
Download and view the complete annual report
Please find page 62 of the 2009 Pentax annual report below. You can navigate through the pages in the report by either clicking on the pages listed below, or by using the keyword search tool below to find specific information within the annual report.-
 1
1 -
2
-
3
-
4
-
5
-
6
-
7
-
8
-
9
-
10
-
11
-
12
-
13
-
14
-
15
-
16
-
17
-
18
-
19
-
20
-
21
-
22
-
23
-
24
-
25
-
26
-
27
-
28
-
29
-
30
-
31
-
32
-
33
-
34
-
35
-
36
-
37
-
38
-
39
-
40
-
41
-
42
-
43
-
44
-
45
-
46
-
47
-
48
-
49
-
50
-
51
-
 52
52 -
 53
53 -
 54
54 -
 55
55 -
 56
56 -
 57
57 -
 58
58 -
 59
59 -
 60
60 -
 61
61 -
 62
62 -
 63
63 -
 64
64 -
 65
65 -
 66
66 -
 67
67 -
 68
68 -
 69
69 -
 70
70 -
 71
71 -
 72
72 -
73
-
74
-
75
-
76
-
77
-
78
-
79
-
80
-
81
-
82
-
83
-
84
-
85
-
86
-
87
-
88
-
89
-
90
-
91
-
92
-
93
-
94
 |
 |

60 HOYA Annual Report 2009
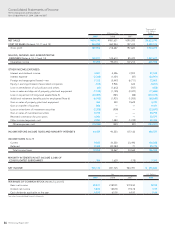
Millions of Yen
Thousands of
U.S. Dollars
(Note 1)
2009 2008 2007 2009
FORWARD ¥ 90,977 ¥ 119,809 ¥ 98,793 $ 926,150
INVESTING ACTIVITIES
Payments for time deposit ¥ (7,108) ¥ — ¥ — $ (72,364)
Proceeds from refund of time deposit 590 — — 6,009
Payments for property, plant and equipment (34,174) (38,889) (52,379) (347,895)
Proceeds from sales of property, plant and equipment 1,170 1,216 10,218 11,912
Payments for investment securities (748) — (408) (7,615)
Proceeds from sales of investment securities 17,876 27 30 181,979
Payment for acquisition of shares of newly consolidated subsidiaries (1,154) (72,463) (908) (11,745)
Payments on merger to minority shareholders (9,398) — — (95,670)
Payments for loans (158) (182) (585) (1,606)
Proceeds from collection of loans 236 102 78 2,404
Payments for purchases of other assets (3,641) (3,225) (3,274) (37,067)
Proceeds from other assets 859 377 576 8,748
Proceeds from transfer of business 1,320 — — 13,438
Net cash used in investing activities (34,330) (113,037) (46,652) (349,472)
FINANCING ACTIVITIES
Net increase (decrease) in short-term loans 31,466 (3,882) — 320,328
Proceeds from long-term bank loans and issuance of corporate bonds 135 99,804 — 1,375
Repayments of long-term debt (8,979) (1,866) — (91,404)
Payments for purchases of treasury stock (6) (30) (13) (61)
Proceeds from sales of treasury stock 32,518 1,934 29
Dividends paid (28,115) (28,076) (25,810) (286,218)
Other (305) (215) (2) (3,102)
Net cash provided by (used in) financing activities (5,801) 68,253 (23,891) (59,053)
FOREIGN CURRENCY TRANSLATION ADJUSTMENTS ON CASH AND
CASH EQUIVALENTS (24,254) (14,311) 8,798 (246,909)
NET INCREASE IN CASH AND CASH EQUIVALENTS 26,592 60,714 37,048 270,716
CASH AND CASH EQUIVALENTS, BEGINNING OF YEAR 181,336 120,622 83,574 1,846,032
CASH AND CASH EQUIVALENTS, END OF YEAR ¥207,928 ¥ 181,336 ¥120,622 $2,116,748
See notes to consolidated financial statements.