Pentax 2009 Annual Report Download - page 49
Download and view the complete annual report
Please find page 49 of the 2009 Pentax annual report below. You can navigate through the pages in the report by either clicking on the pages listed below, or by using the keyword search tool below to find specific information within the annual report.-
 1
1 -
2
-
3
-
4
-
5
-
6
-
7
-
8
-
9
-
10
-
11
-
12
-
13
-
14
-
15
-
16
-
17
-
18
-
19
-
20
-
21
-
22
-
23
-
24
-
25
-
26
-
27
-
28
-
29
-
30
-
31
-
32
-
33
-
34
-
35
-
36
-
37
-
38
-
 39
39 -
 40
40 -
 41
41 -
 42
42 -
 43
43 -
 44
44 -
 45
45 -
 46
46 -
 47
47 -
 48
48 -
 49
49 -
 50
50 -
 51
51 -
 52
52 -
 53
53 -
 54
54 -
 55
55 -
 56
56 -
 57
57 -
 58
58 -
 59
59 -
60
-
61
-
62
-
63
-
64
-
65
-
66
-
67
-
68
-
69
-
70
-
71
-
72
-
73
-
74
-
75
-
76
-
77
-
78
-
79
-
80
-
81
-
82
-
83
-
84
-
85
-
86
-
87
-
88
-
89
-
90
-
91
-
92
-
93
-
94
 |
 |
0
30,000
60,000
90,000
120,000
150,000
0
4
8
12
16
20
0
10,000
20,000
30,000
40,000
50,000
0
6
12
18
24
30
47
HOYA Annual Report 2009
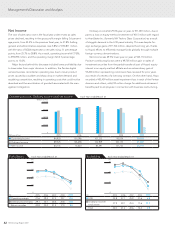
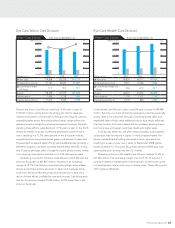
Eye Care (Vision Care Division)
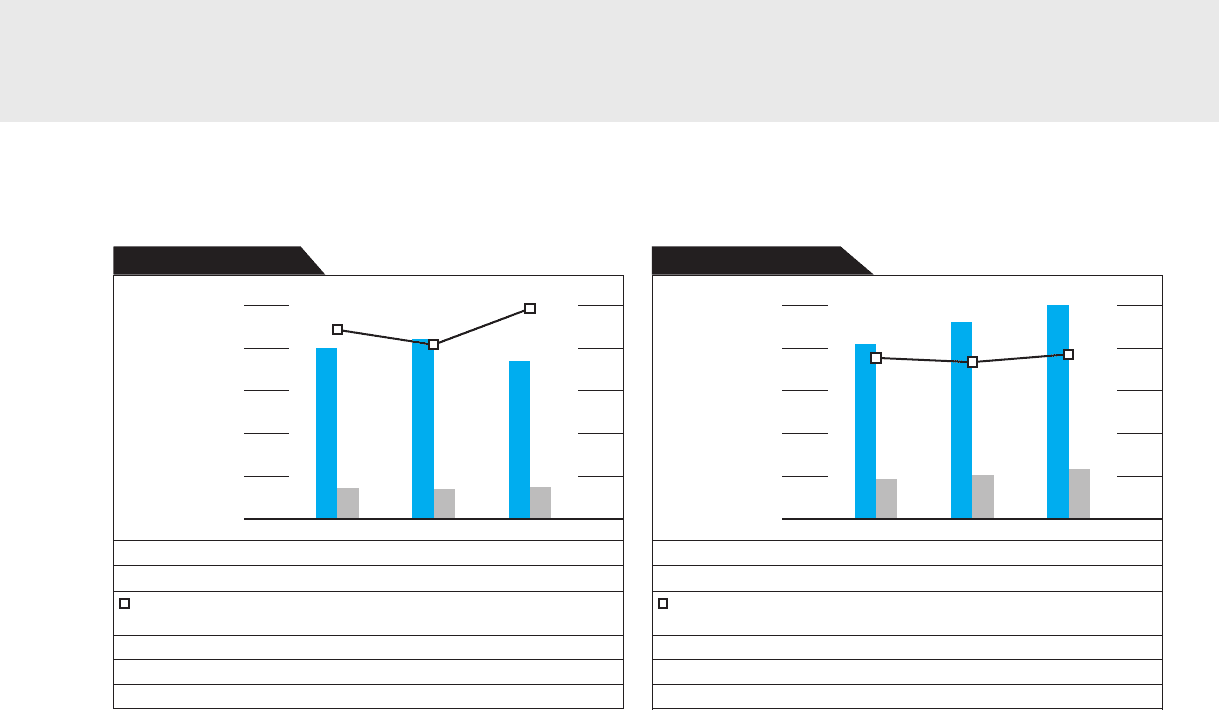
Sales in the Vision Care Division declined 12.4% year on year to
¥110,725 million, mainly due to the strong yen. As the Japanese
market continued to contract due to falling prices, Hoya focused on
expanding sales across its broad product lineup, ranging from pro-
gressive lenses to single-focus lenses and special coatings. Notwith-
standing these efforts, sales declined 11.7% year on year. In the North
American market, financial uncertainty depressed consumer senti-
ment, resulting in a 12.3% sales decline. In the European market,
competition from low-priced lenses grew more intense. In response,
Hoya worked to expand sales of high-value-added lenses, primarily in
Western European countries, but sales nevertheless fell 6.5%. In Asia
and Oceania, although sales of single-focus and photochromic lenses
rose, slowing consumption resulted in a 12.3% decrease in sales.
Operating income for the Vision Care Division rose 5.6% over the
previous fiscal year, to ¥21,807 million, resulting in an operating
margin of 19.7%. The division promoted sales of high-value-added
lenses and introduced new products in Japan and overseas, while
working to enhance efficient production frameworks in Asia. As a
result of these efforts, profitability rose year on year. Capital expendi-
ture for this division totaled ¥7,294 million, 22.7% lower than in the
previous fiscal year.
Eye Care (Health Care Division)
In the Health Care Division, sales rose 8.2% year on year, to ¥49,968
million. Eye City, our chain of directly managed contact lens specialty
stores, drew more customers through consulting-based sales, and
expanded sales of high-value-added products. As a result, although
the total number of stores in Japan did not increase, existing stores
won more new and repeat customers, leading to higher sales.
In intraocular lenses for use after cataract surgery, a new aspheri-
cal product was introduced in Japan. In the European market, the
division worked hard at selling ultra small incision-type products,
resulting in a year-on-year rise in sales. In September 2008, yellow
lenses received U.S. Food and Drug Administration (FDA) approval,
opening the door to entry into the U.S. market.
Operating income in the Health Care Division climbed 13.6% to
¥11,544 million. The operating margin rose to 23.1%. The division
actively invested in marketing for further growth, as well as new prod-
uct development, while continuing to reduce costs. These efforts paid
off in higher profitability.
(%)
Vision Care Division Each Year ended March 31
(Millions of Yen) 2007 2008 2009
n Net sales 40,850 46,177 49,968
n Operating income 9,215 10,166 11,544
Operating margin (%)
Note 22.6 22.0 23.1
Assets 24,410 24,416 26,609
Depreciation 1,170 1,311 1,215
Capital expenditures 2,119 848 1,507
(%)
Health Care Division Each Year ended March 31
(Millions of Yen) 2007 2008 2009
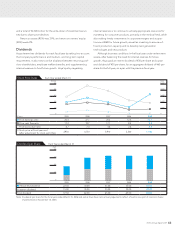
n Net sales 119,808 126,338 110,725
n Operating income 21,167 20,653 21,807
Operating margin
(%) Note 17.7 16.3 19.7
Assets 118,229 112,379 101,603
Depreciation 7,405 7,728 7,685
Capital expenditures 11,672 9,434 7,294
(Millions of Yen) (Millions of Yen)