Pentax 2009 Annual Report Download - page 47
Download and view the complete annual report
Please find page 47 of the 2009 Pentax annual report below. You can navigate through the pages in the report by either clicking on the pages listed below, or by using the keyword search tool below to find specific information within the annual report.-
 1
1 -
2
-
3
-
4
-
5
-
6
-
7
-
8
-
9
-
10
-
11
-
12
-
13
-
14
-
15
-
16
-
17
-
18
-
19
-
20
-
21
-
22
-
23
-
24
-
25
-
26
-
27
-
28
-
29
-
30
-
31
-
32
-
33
-
34
-
35
-
36
-
 37
37 -
 38
38 -
 39
39 -
 40
40 -
 41
41 -
 42
42 -
 43
43 -
 44
44 -
 45
45 -
 46
46 -
 47
47 -
 48
48 -
 49
49 -
 50
50 -
 51
51 -
 52
52 -
 53
53 -
 54
54 -
 55
55 -
 56
56 -
 57
57 -
58
-
59
-
60
-
61
-
62
-
63
-
64
-
65
-
66
-
67
-
68
-
69
-
70
-
71
-
72
-
73
-
74
-
75
-
76
-
77
-
78
-
79
-
80
-
81
-
82
-
83
-
84
-
85
-
86
-
87
-
88
-
89
-
90
-
91
-
92
-
93
-
94
 |
 |
45
HOYA Annual Report 2009
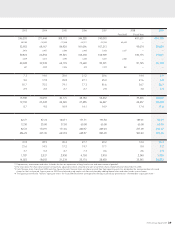
Segment Information
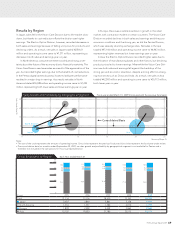
Details of each segment and growth rate and profitability by business segment are as follows.
Business Categories for the Year Ended March 31, 2009
Business
Category Division Products and Services
Information
Technology
Electro-Optics
Photomasks and mask blanks for semiconductors, masks and devices for liquid-crystal displays
(LCDs), glass disks for hard disk drives (HDDs), optical lenses, optical glasses, electronic
glasses, optical communication products, etc.
Photonics Laser equipment, light sources for electronics industry, special optical glasses
Eye Care Vision Care Eyeglass lenses, eyeglass frames
Health Care Contact lenses and accessories, intraocular lenses
Pentax
Endoscopes, medical accessories, bone prosthesis, CHT Ceramic Hydroxyapatite, digital
cameras, interchangeable lenses, digital camera accessories and modules, micro lenses, CCTV
lenses
Others Crystal glass products; design of information systems, outsourcing, etc.
Sales and Operating Income by Segment
The Year Ended March 31, 2009 Information Technology Eye Care Pentax Others Eliminations
or
Corporate
(Millions of Yen)
Electro-
Optics Photonics Vision Care Health Care Total Consolidated
Sales to customers 163,902 6,367 110,725 49,968 122,190 1,043 454,195 — 454,195
Intersegment sales 274 583 11 — 13 4,073 4,954 (4,954) —
Total sales 164,176 6,950 110,736 49,968 122,203 5,116 459,149 (4,954) 454,195
Operating income (loss) 39,712 297 21,807 11,544 (11,572) 235 62,023 (2,928) 59,095
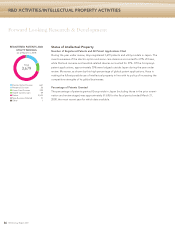
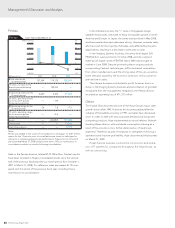
Sales Growth and Profitability of Main Business Segments Fiscal year ended March 31, 2009 (Compared with the previous fiscal year)
Electro-Optics
Vision Care
Health Care
15 20 25 30 35
Consolidated Basis
–30
–20
–10
0
10
20
Sales Growth Ratio (%)
Operating Margin (%)
Notes:
1: The size of the circle represents the amount of operating income. Grey circles represent the previous fiscal year; blue circles represent the fiscal year under review.
2: Pentax has been omitted from this visual representation.