Pentax 2009 Annual Report Download - page 58
Download and view the complete annual report
Please find page 58 of the 2009 Pentax annual report below. You can navigate through the pages in the report by either clicking on the pages listed below, or by using the keyword search tool below to find specific information within the annual report.-
 1
1 -
2
-
3
-
4
-
5
-
6
-
7
-
8
-
9
-
10
-
11
-
12
-
13
-
14
-
15
-
16
-
17
-
18
-
19
-
20
-
21
-
22
-
23
-
24
-
25
-
26
-
27
-
28
-
29
-
30
-
31
-
32
-
33
-
34
-
35
-
36
-
37
-
38
-
39
-
40
-
41
-
42
-
43
-
44
-
45
-
46
-
47
-
 48
48 -
 49
49 -
 50
50 -
 51
51 -
 52
52 -
 53
53 -
 54
54 -
 55
55 -
 56
56 -
 57
57 -
 58
58 -
 59
59 -
 60
60 -
 61
61 -
 62
62 -
 63
63 -
 64
64 -
 65
65 -
 66
66 -
 67
67 -
 68
68 -
69
-
70
-
71
-
72
-
73
-
74
-
75
-
76
-
77
-
78
-
79
-
80
-
81
-
82
-
83
-
84
-
85
-
86
-
87
-
88
-
89
-
90
-
91
-
92
-
93
-
94
 |
 |

56 HOYA Annual Report 2009
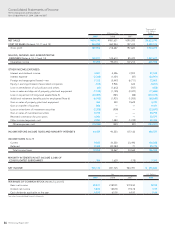
Consolidated Statements of Income
HOYA Corporation and Subsidiaries
Years Ended March 31, 2009, 2008 and 2007
Millions of Yen
Thousands of
U.S. Dollars
(Note 1)
2009 2008 2007 2009
NET SALES ¥454,195 ¥481,631 ¥390,093 $4,623,790
COST OF SALES (Notes 6, 10, 11 and 14) 264,289 262,944 197,410 2,690,515
Gross profit 189,906 218,687 192,683 1,933,275
SELLING, GENERAL AND ADMINISTRATIVE
EXPENSES (Notes 6, 10, 11 and 14) 130,811 123,613 85,470 1,331,677
Operating income 59,095 95,074 107,213 601,598
OTHER INCOME (EXPENSES):
Interest and dividend income 4,081 4,596 2,922 41,543
Interest expense (2,348) (1,451) (87) (23,901)
Foreign exchange gains (losses)—net 7,152 (5,447) (6,711) 72,805
Equity in earnings (losses) of associated companies (315) 5,926 642 (3,207)
Loss on remediation of soil pollution and others (65) (1,612) (767) (658)
Loss on sales and disposal of property, plant and equipment (1,148) (1,125) (3,327) (11,684)
Loss on impairment of long-lived assets (Note 5) (30,459) (581) (88) (310,075)
Additional retirement benefits paid to employees (Note 6) (6,743) (1,921) (1,055) (68,645)
Gain on sales of property, plant and equipment 366 520 9,629 3,720
Gain on transfer of business 886 — — 9,021
Loss on write-down of investment securities (2,328) (909) — (23,697)
Gain on sales of investment securities 9,705 — — 98,795
Received commission for prior years 3,200 — — 32,577
Other income (expense)—net 2,980 1,483 (1,239) 30,335
Other expenses—net (15,036) (521) (81) (153,071)
INCOME BEFORE INCOME TAXES AND MINORITY INTERESTS 44,059 94,553 107,132 448,527
INCOME TAXES (Note 9)
Current 9,845 34,550 23,492 100,228
Deferred 9,408 (20,083) 71 95,775
Total income taxes 19,253 14,467 23,563 196,003
MINORITY INTERESTS IN NET INCOME (LOSS) OF
CONSOLIDATED SUBSIDIARIES 304 1,639 (178) 3,100
NET INCOME ¥25,110 ¥81,725 ¥83,391 $ 255,624
Yen U.S. Dollars
2009 2008 2007 2009
PER SHARE OF COMMON STOCK (Notes 2.q and 15)
Basic net income ¥58.01 ¥189.01 ¥193.50 $0.59
Diluted net income 58.00 188.78 192.78 0.59
Cash dividends applicable to the year 65.00 65.00 65.00 0.66
See notes to consolidated financial statements.