Pentax 2009 Annual Report Download - page 4
Download and view the complete annual report
Please find page 4 of the 2009 Pentax annual report below. You can navigate through the pages in the report by either clicking on the pages listed below, or by using the keyword search tool below to find specific information within the annual report.-
 1
1 -
 2
2 -
 3
3 -
 4
4 -
 5
5 -
 6
6 -
 7
7 -
 8
8 -
 9
9 -
 10
10 -
 11
11 -
 12
12 -
 13
13 -
 14
14 -
 15
15 -
16
-
17
-
18
-
19
-
20
-
21
-
22
-
23
-
24
-
25
-
26
-
27
-
28
-
29
-
30
-
31
-
32
-
33
-
34
-
35
-
36
-
37
-
38
-
39
-
40
-
41
-
42
-
43
-
44
-
45
-
46
-
47
-
48
-
49
-
50
-
51
-
52
-
53
-
54
-
55
-
56
-
57
-
58
-
59
-
60
-
61
-
62
-
63
-
64
-
65
-
66
-
67
-
68
-
69
-
70
-
71
-
72
-
73
-
74
-
75
-
76
-
77
-
78
-
79
-
80
-
81
-
82
-
83
-
84
-
85
-
86
-
87
-
88
-
89
-
90
-
91
-
92
-
93
-
94
 |
 |

2005 2006 2007 20092008
0
100,000
200,000
300,000
400,000
500,000
2005 2006 2007 20092008
0
40,000
80,000
160,000
120,000
0
10
30
20
2005 2006 2007 20092008
0
50
100
150
250
200
30
20
10
0
2005 2006 2007 2008Note 2 2009
For the year:
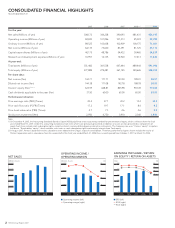
Net sales (Millions of yen) 308,172 344,228 390,093 481,631 454,195
Operating income (Millions of yen) 84,920 101,096 107,213 95,074 59,095
Ordinary income (Millions of yen) 89,525 103,638 102,909 100,175 71,081
Net income (Millions of yen) 64,135 75,620 83,391 81,725 25,110
Capital expenditures (Millions of yen) 40,175 48,786 54,432 39,465 34,839
Research and development expenses (Billions of yen) 10,957 14,135 14,920 17,413 17,630
At year-end:
Total assets (Millions of yen) 351,482 361,538 447,644 689,444 591,096
Total equity (Millions of yen) 277,889 279,481 367,145 394,626 338,010
Per share data:
Net income (Yen) 144.71 171.71 193.50 189.01 58.01
Diluted net income (Yen) 144.38 171.08 192.78 188.78 58.00
Owners’ equity (Yen) (Note 1) 623.59 648.87 845.98 903.49 774.65
Cash dividends applicable to the year (Yen) 37.50 60.00 65.00 65.00 65.00
Performance Indicators:
Price earnings ratio (PER) (Times) 20.4 27.7 20.2 12.4 33.3
Price cash flow ratio (PCFR) (Times) 17.2 19.7 17.1 8.4 9.2
Price book value ratio (PBR) (Times) 4.7 7.3 4.6 2.6 2.5
Stock price at year-end (Yen) 2,950 4,750 3,910 2,340 1,930
Note
1) On December 9, 2005, the Accounting Standards Board of Japan (ASBJ) published a new accounting standard for presentation of equity, which is effective from the fiscal
year ended March 31, 2007. Under this accounting standard, certain items which were previously presented as liabilities or assets are now presented as components of
equity. Such items include stock subscription rights, minority interests and any deferred gain on derivative instruments. The Company now uses “Owners’ equity” to replace
the former “Shareholders’ equity”, which excludes such items as stock subscription rights and minority interests from Total equity.
2) In August 2007, Pentax Corporation and its subsidiaries were added to the Group’s scope of consolidation. Therefore, performance figures shown include the results of
Pentax Corporation and its subsidiaries from the second half of the fiscal year ended March 31, 2008 (the six-month period from October 1, 2007 to March 31, 2008).
CONSOLIDATED FINANCIAL HIGHLIGHTS
Years Ended March 31
NET SALES
OPERATING INCOME /
OPERATING MARGIN
EARNINGS PER SHARE / RETURN
ON EQUITY / RETURN ON ASSETS
(Millions of yen) (Millions of yen) (%) (Yen) (%)
n Operating income (left)
Operating margin (right)
n EPS (left)
ROE (right)
ROA (right)
2HOYA Annual Report 2009