Pentax 2009 Annual Report Download - page 81
Download and view the complete annual report
Please find page 81 of the 2009 Pentax annual report below. You can navigate through the pages in the report by either clicking on the pages listed below, or by using the keyword search tool below to find specific information within the annual report.-
 1
1 -
2
-
3
-
4
-
5
-
6
-
7
-
8
-
9
-
10
-
11
-
12
-
13
-
14
-
15
-
16
-
17
-
18
-
19
-
20
-
21
-
22
-
23
-
24
-
25
-
26
-
27
-
28
-
29
-
30
-
31
-
32
-
33
-
34
-
35
-
36
-
37
-
38
-
39
-
40
-
41
-
42
-
43
-
44
-
45
-
46
-
47
-
48
-
49
-
50
-
51
-
52
-
53
-
54
-
55
-
56
-
57
-
58
-
59
-
60
-
61
-
62
-
63
-
64
-
65
-
66
-
67
-
68
-
69
-
70
-
 71
71 -
 72
72 -
 73
73 -
 74
74 -
 75
75 -
 76
76 -
 77
77 -
 78
78 -
 79
79 -
 80
80 -
 81
81 -
 82
82 -
 83
83 -
 84
84 -
 85
85 -
 86
86 -
 87
87 -
 88
88 -
 89
89 -
 90
90 -
 91
91 -
92
-
93
-
94
 |
 |

79
HOYA Annual Report 2009
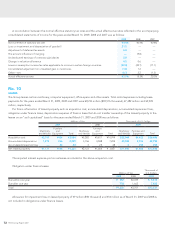
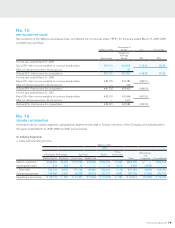
No. 15
NET INCOME PER SHARE
Reconciliation of the differences between basic and diluted net income per share (“EPS”) for the years ended March 31, 2009, 2008
and 2007 was as follows:
Millions of Yen
Thousands of
Shares Yen U.S. Dollars
Net Income
Weighted-
Average
Shares EPS EPS
For the year ended March 31, 2009
Basic EPS—Net income available to common shareholders ¥25,110 432,858 ¥ 58.01 $0.59
Effect of dilutive securities—Stock options — 67
Diluted EPS—Net income for computation ¥25,110 432,925 ¥ 58.00 $0.59
For the year ended March 31, 2008
Basic EPS—Net income available to common shareholders ¥ 81,725 432,383 ¥189.01
Effect of dilutive securities—Stock options — 522
Diluted EPS—Net income for computation ¥ 81,725 432,905 ¥188.78
For the year ended March 31, 2007
Basic EPS—Net income available to common shareholders ¥ 83,391 430,968 ¥193.50
Effect of dilutive securities—Stock options — 1,615
Diluted EPS—Net income for computation ¥ 83,391 432,583 ¥192.78
No. 16
SEGMENT INFORMATION
Information about industry segments, geographical segments and sales to foreign customers of the Company and subsidiaries for
the years ended March 31, 2009, 2008 and 2007 was as follows:
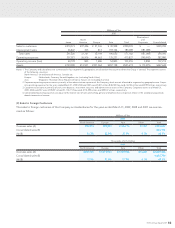
(1) Industry Segments
a. Sales and Operating Income
Millions of Yen
2009
Information Technology Eye Care Pentax
Other
Businesses
Total
Eliminations
and
Corporate ConsolidatedElectro-Optics Photonics Vision Care Health Care
Sales to customers ¥163,902 ¥6,367 ¥110,725 ¥49,968 ¥122,190 ¥1,043 ¥454,195 ¥ — ¥454,195
Intersegment sales 274 583 11 — 13 4,073 4,954 (4,954) —
Total sales 164,176 6,950 110,736 49,968 122,203 5,116 459,149 (4,954) 454,195
Operating expenses 124,464 6,653 88,929 38,424 133,775 4,881 397,126 (2,026) 395,100
Operating income (loss) ¥ 39,712 ¥ 297 ¥ 21,807 ¥11,544 ¥ (11,572) ¥ 235 ¥ 62,023 ¥(2,928) ¥ 59,095