Pentax 2009 Annual Report Download - page 52
Download and view the complete annual report
Please find page 52 of the 2009 Pentax annual report below. You can navigate through the pages in the report by either clicking on the pages listed below, or by using the keyword search tool below to find specific information within the annual report.
200,000
0
400,000
600,000
800,000 80
40
60
20
0
50 HOYA Annual Report 2009
Financial Position
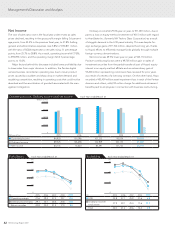
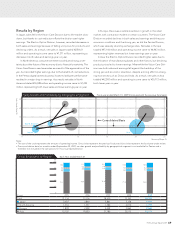
Total assets as of March 31, 2009 stood at ¥591,096 million, a ¥98,347
million decrease compared with a year earlier.
Current assets declined 6.3% year on year, to ¥384,466 million.
Cash and cash equivalents rose 14.7% from a year earlier, to ¥207,928
million, while notes and accounts receivable—trade decreased 31.2%
to ¥82,875 million and inventories decreased 14.0%, to ¥71,258 million.
Non-current assets decreased ¥72,541 million from the previous
fiscal year-end to ¥206,630 million. This reflected a decrease due to
impairment losses on non-current assets of Pentax, as well as a
decrease in the property, plant and equipment of subsidiaries outside
of Japan due to the yen’s appreciation, and a decline in investment
securities as a result of the partial sale of part of the Company’s equity
interest in equity-method affiliate AvanStrate Inc. (formerly NH Techno
Glass Corporation)
Total liabilities were down ¥41,732 million from the previous fiscal
year-end, to ¥253,086 million. Although short-term loans payable
increased ¥31,534 million, notes and accounts payable—trade
decreased by ¥25,981 million, and income taxes payable decreased
by ¥23,520 million.
Total interest-bearing debt, including short-term loans, long-term
debt with current maturities, commercial paper, other long-term debt,
and corporate bonds and other, amounted to ¥159,714 million, result-
ing in a 27.0% rate of leverage.
Total equity declined ¥56,616 million year on year, to ¥338,010
million due to declines of ¥5,779 million in retained earnings and
¥50,521 million in foreign currency translation adjustments. Owners’
equity, total equity less stock subscription rights and minority interests,
amounted to ¥335,314 million, for an owners’ equity ratio of 56.7%.
Capital Expenditures/
Depreciation and Amortization
Capital expenditures during the fiscal year under review totaled
¥34,839 million, 11.7% less than in the previous fiscal year. Investment
in the Electro-Optics Division accounted for approximately 60% of the
total, with a focus on expanding and strengthening facilities for semi-
conductor-related miniaturization projects and glass disks for HDDs,
which are seeing rapid gains in recording capacity.
Total Assets, Owners’ Equity and Owners’ Equity Ratio Each Year ended March 31
(Millions of yen) 2005 2006 2007 2008 2009
n Total assets 351,482 361,538 447,644 689,444 591,096
n Owners’ equity 277,889 279,481 365,102 391,084 335,314
Owners’ equity ratio (%) 79.1 77.3 81.6 56.7 56.7
(Millions of yen) (%)
Management’s Discussion and Analysis


