Pentax 2008 Annual Report Download - page 84
Download and view the complete annual report
Please find page 84 of the 2008 Pentax annual report below. You can navigate through the pages in the report by either clicking on the pages listed below, or by using the keyword search tool below to find specific information within the annual report.-
 1
1 -
2
-
3
-
4
-
5
-
6
-
7
-
8
-
9
-
10
-
11
-
12
-
13
-
14
-
15
-
16
-
17
-
18
-
19
-
20
-
21
-
22
-
23
-
24
-
25
-
26
-
27
-
28
-
29
-
30
-
31
-
32
-
33
-
34
-
35
-
36
-
37
-
38
-
39
-
40
-
41
-
42
-
43
-
44
-
45
-
46
-
47
-
48
-
49
-
50
-
51
-
52
-
53
-
54
-
55
-
56
-
57
-
58
-
59
-
60
-
61
-
62
-
63
-
64
-
65
-
66
-
67
-
68
-
69
-
70
-
71
-
72
-
73
-
 74
74 -
 75
75 -
 76
76 -
 77
77 -
 78
78 -
 79
79 -
 80
80 -
 81
81 -
 82
82 -
 83
83 -
 84
84 -
 85
85 -
 86
86 -
 87
87 -
 88
88 -
 89
89 -
 90
90 -
 91
91 -
 92
92
 |
 |

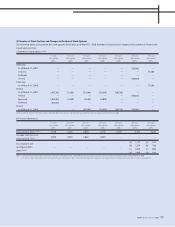
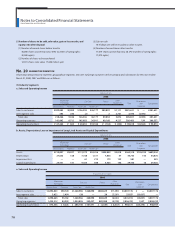
Overseas sales (A)
Consolidated sales (B)
(A)/(B)
¥44,954
11.5%
¥211,546
390,093
54.2%
¥8
0.0%
¥113,060
29.0%
¥53,524
13.7%
Millions of Yen
2007
Note: The Company and subsidiaries are summarized in four segments by geographic area based on the countries where the customers are located. The segments consist of the following countries:
North America: United States of America, Canada, etc.
Europe: Netherlands, Germany, United Kingdom, etc. (including South Africa)
Asia: Singapore, Thailand, Republic of Korea, Taiwan, etc. (including Australia)
Other: Saudi Arabia and Brazil, etc.
North America Europe Asia Other Total
Overseas sales (A)
Consolidated sales (B)
(A)/(B)
¥42,673
12.4%
¥170,722
344,228
49.6%
¥860
0.2%
¥85,988
25.0%
¥41,201
12.0%
Millions of Yen
2006
North America Europe Asia Other Total
Notes to Consolidated Financial Statements
Hoya Corporation and Subsidiaries
82