Pentax 2008 Annual Report Download - page 80
Download and view the complete annual report
Please find page 80 of the 2008 Pentax annual report below. You can navigate through the pages in the report by either clicking on the pages listed below, or by using the keyword search tool below to find specific information within the annual report.-
 1
1 -
2
-
3
-
4
-
5
-
6
-
7
-
8
-
9
-
10
-
11
-
12
-
13
-
14
-
15
-
16
-
17
-
18
-
19
-
20
-
21
-
22
-
23
-
24
-
25
-
26
-
27
-
28
-
29
-
30
-
31
-
32
-
33
-
34
-
35
-
36
-
37
-
38
-
39
-
40
-
41
-
42
-
43
-
44
-
45
-
46
-
47
-
48
-
49
-
50
-
51
-
52
-
53
-
54
-
55
-
56
-
57
-
58
-
59
-
60
-
61
-
62
-
63
-
64
-
65
-
66
-
67
-
68
-
69
-
 70
70 -
 71
71 -
 72
72 -
 73
73 -
 74
74 -
 75
75 -
 76
76 -
 77
77 -
 78
78 -
 79
79 -
 80
80 -
 81
81 -
 82
82 -
 83
83 -
 84
84 -
 85
85 -
 86
86 -
 87
87 -
 88
88 -
 89
89 -
 90
90 -
91
-
92
 |
 |

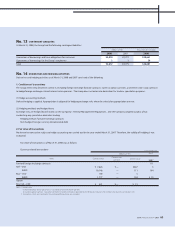
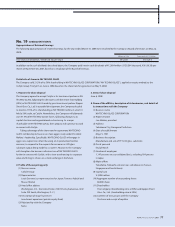
5. Number of shares to be sold, sale value, gain or loss on sale, and
equity ratio after disposal
(1) Number of owned shares before transfer
30,000 shares (ownership ratio: 50%) (number of voting rights:
30,000 rights)
(2) Number of shares to be transferred
12,921 shares (sale value: 17,400 million yen)
(3) Gain on sale
10.4 billion yen will be recorded as other income.
(4) Number of owned shares after transfer
17,079 shares (ownership ratio: 28.5%) (number of voting rights:
17,079 rights)
Sales to customers
Intersegment sales
Total sales
Operating expenses
Operating income (loss)
¥209,883
383
210,266
142,802
¥ 67,464
¥9,090
246
9,336
8,512
¥ 824
¥126,338
(2)
126,336
105,683
¥ 20,653
¥46,177
—
46,177
36,011
¥10,166
¥89,032
2
89,034
89,168
¥ (134)
¥1,111
2,761
3,872
4,227
¥ (355)
¥481,631
3,390
485,021
386,403
¥ 98,618
¥ —
(3,390)
(3,390)
154
¥(3,544)
¥481,631
—
481,631
386,557
¥ 95,074
Millions of Yen
2008
Information
Technology
Electro-Optics Photonics Vision Care Health Care
Eye Care Pentax Other
Businesses Total
Eliminations
and
Corporate
Consolidated
Assets
Depreciation
Impairment loss
Capital expenditures
¥210,007
27,653
—
24,431
¥8,037
138
—
141
¥112,379
7,728
61
9,434
¥24,416
1,311
212
848
¥204,853
7,856
179
4,455
¥2,818
47
129
146
¥562,510
44,733
581
39,455
¥126,934
143
—
10
¥689,444
44,876
581
39,465
Millions of Yen
2008
Information
Technology
Electro-Optics Photonics Vision Care Health Care
Eye Care Pentax Other
Businesses Total
Eliminations
and
Corporate
Consolidated
Sales to customers
Intersegment sales
Total sales
Operating expenses
Operating income (loss)
$2,094,843
3,822
2,098,665
1,425,312
$ 673,353
$90,728
2,454
93,182
84,959
$ 8,223
$1,260,986
(20)
1,260,966
1,054,826
$ 206,140
$460,898
—
460,898
359,427
$101,471
$888,629
20
888,649
889,988
$ (1,339)
$11,092
27,561
38,653
42,190
$ (3,537)
$4,807,176
33,837
4,841,013
3,856,702
$ 984,311
$ —
(33,837)
(33,837)
1,537
$(35,374)
$4,807,176
—
4,807,176
3,858,239
$ 948,937
Thousands of U.S. Dollars
2008
Information
Technology
Electro-Optics Photonics Vision Care Health Care
Eye Care Pentax Other
Businesses Total
Eliminations
and
Corporate
Consolidated
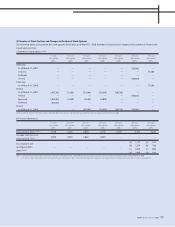
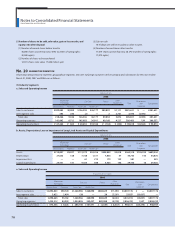
No. 20 SEGMENT INFORMATION
Notes to Consolidated Financial Statements
Hoya Corporation and Subsidiaries
Information about industry segments, geographical segments and sales to foreign customers of the Company and subsidiaries for the years ended
March 31, 2008, 2007 and 2006 was as follows:
(1) Industry Segments
a. Sales and Operating Income
b. Assets, Depreciation, Loss on Impairment of Long-Lived Assets and Capital Expenditures
a. Sales and Operating Income
78