Pentax 2008 Annual Report Download - page 83
Download and view the complete annual report
Please find page 83 of the 2008 Pentax annual report below. You can navigate through the pages in the report by either clicking on the pages listed below, or by using the keyword search tool below to find specific information within the annual report.-
 1
1 -
2
-
3
-
4
-
5
-
6
-
7
-
8
-
9
-
10
-
11
-
12
-
13
-
14
-
15
-
16
-
17
-
18
-
19
-
20
-
21
-
22
-
23
-
24
-
25
-
26
-
27
-
28
-
29
-
30
-
31
-
32
-
33
-
34
-
35
-
36
-
37
-
38
-
39
-
40
-
41
-
42
-
43
-
44
-
45
-
46
-
47
-
48
-
49
-
50
-
51
-
52
-
53
-
54
-
55
-
56
-
57
-
58
-
59
-
60
-
61
-
62
-
63
-
64
-
65
-
66
-
67
-
68
-
69
-
70
-
71
-
72
-
 73
73 -
 74
74 -
 75
75 -
 76
76 -
 77
77 -
 78
78 -
 79
79 -
 80
80 -
 81
81 -
 82
82 -
 83
83 -
 84
84 -
 85
85 -
 86
86 -
 87
87 -
 88
88 -
 89
89 -
 90
90 -
 91
91 -
 92
92
 |
 |
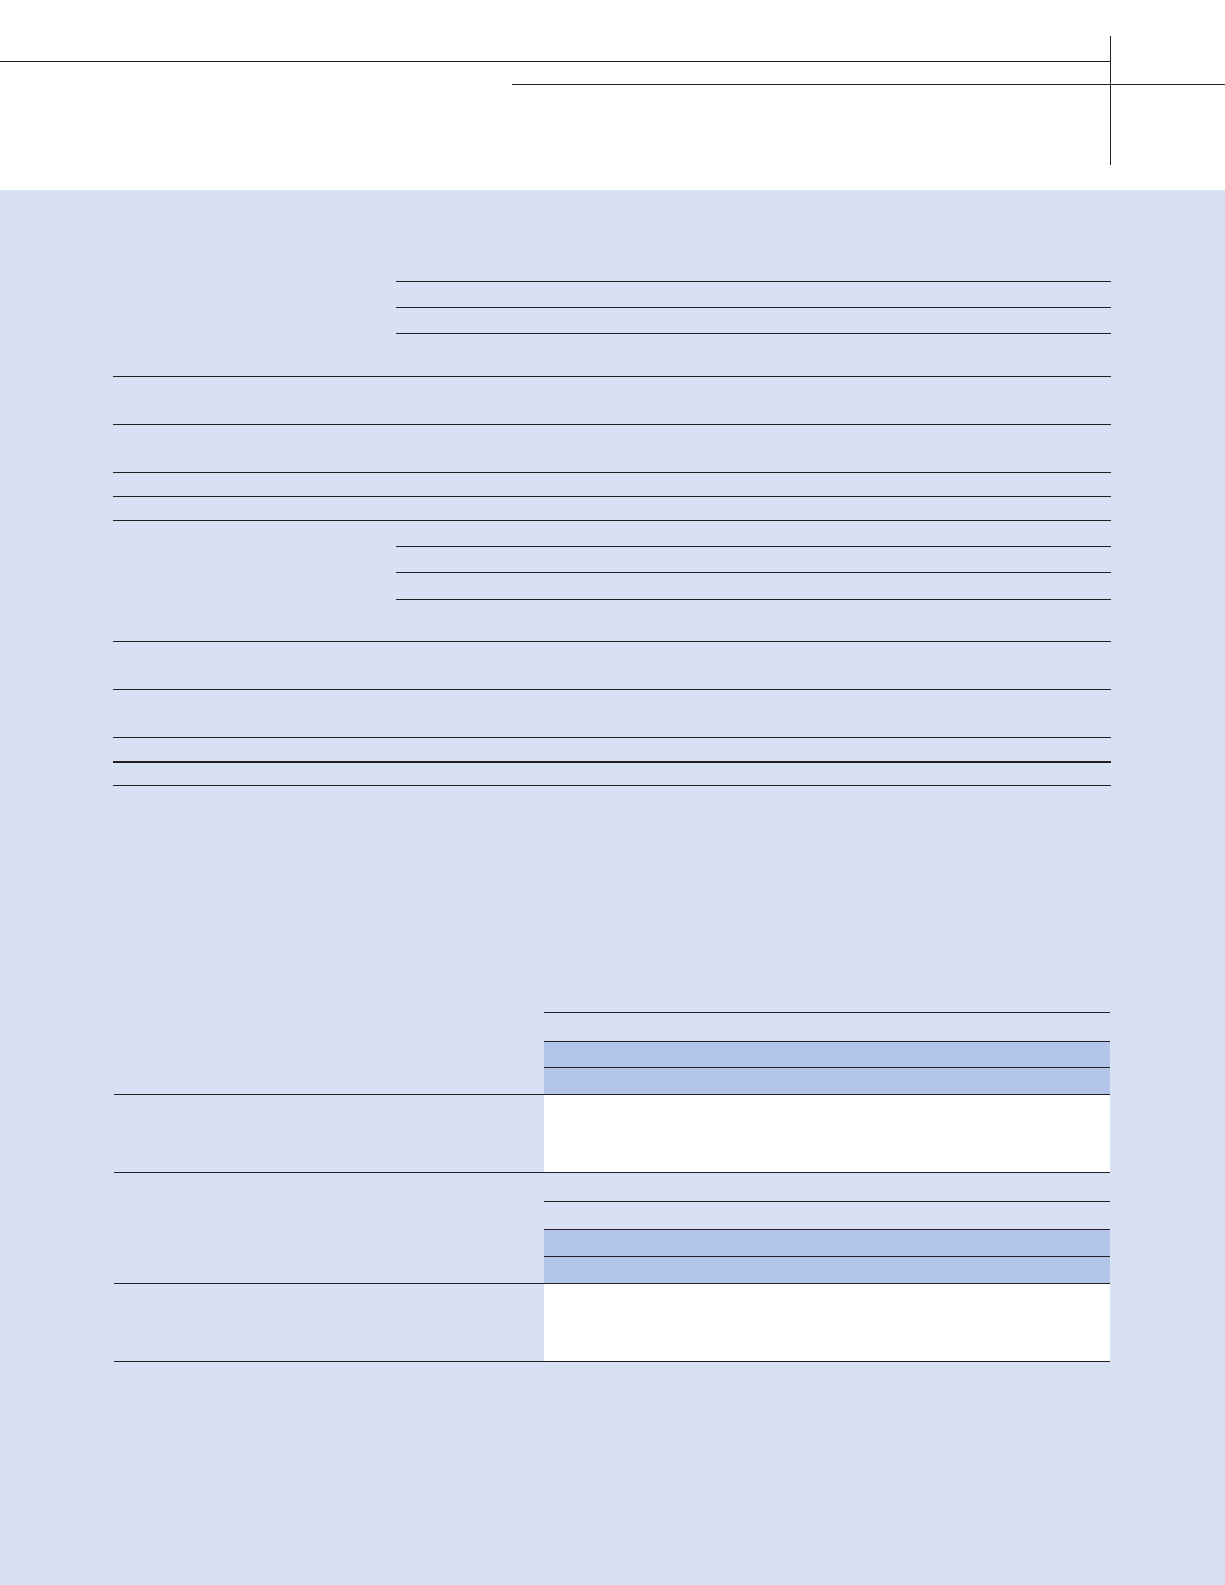
Sales to customers
Interarea transfers
Total sales
Operating expenses
Operating income (loss)
Assets
¥270,373
26,847
297,220
257,021
¥ 40,199
¥193,390
¥390,093
—
390,093
282,880
¥107,213
¥447,644
¥ —
(187,089)
(187,089)
(190,947)
¥ 3,858
¥ (73,975)
¥390,093
187,089
577,182
473,827
¥103,355
¥521,619
¥ 30,928
159,124
190,052
135,227
¥ 54,825
¥207,158
¥ 51,336
813
52,149
44,663
¥ 7,486
¥107,564
¥37,456
305
37,761
36,916
¥ 845
¥13,507
Millions of Yen
2007
Japan North
America Europe Asia Total Eliminations
and Corporate Consolidated
Sales to customers
Interarea transfers
Total sales
Operating expenses
Operating income (loss)
Assets
¥244,998
23,901
268,899
230,414
¥ 38,485
¥163,840
¥344,228
—
344,228
243,132
¥101,096
¥361,538
¥ —
(145,619)
(145,619)
(152,481)
¥ 6,862
¥ (37,324)
¥344,228
145,619
489,847
395,613
¥ 94,234
¥398,862
¥ 24,527
120,813
145,340
97,226
¥ 48,114
¥149,299
¥39,232
683
39,915
33,367
¥ 6,548
¥63,346
¥35,471
222
35,693
34,606
¥ 1,087
¥22,377
Millions of Yen
2006
Japan North
America Europe Asia Total Eliminations
and Corporate Consolidated
Overseas sales (A)
Consolidated sales (B)
(A)/(B)
¥59,294
12.3%
¥293,111
481,631
60.9%
¥1,268
0.3%
¥140,433
29.2%
¥92,116
19.1%
Millions of Yen
2008
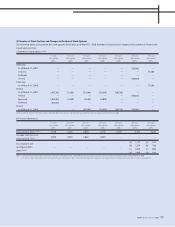
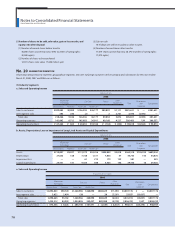
Notes: 1. The Company and subsidiaries are summarized in four segments by geographic area based on the countries where the Group is located. The segments consist of the following countries:
North America: United States of America, Canada, etc.
Europe: Netherlands, Germany, United Kingdom, etc. (including South Africa)
Asia: Singapore, Thailand, China, Republic of Korea, Taiwan, etc. (including Australia)
2. Corporate operating expenses consist primarily of the administration expenses of the Company, which are not allocated to segments by geographic area. Corporate operating expenses for
the years ended March 31, 2008, 2007 and 2006 were ¥4,142 million ($41,341 thousand), ¥2,993 million and ¥2317 million, respectively.
3. Corporate assets consist primarily of cash, time deposits, investment securities and administrative assets of the Company. Corporate assets as of March 31, 2008, 2007 and 2006 were
¥115,499 million ($1,152,800 thousand), ¥59,047 million and ¥33,959 million, respectively.
4. Consolidated operating expenses are equal to the total of cost of sales and selling, general and administrative expenses shown in the accompanying consolidated statements of income.
North America Europe Asia Other Total
Overseas sales (A)
Consolidated sales (B)
(A)/(B)
$591,815
12.3%
$2,925,551
4,807,176
60.9%
$12,656
0.3%
$1,401,667
29.2%
$919,413
19.1%
Thousands of U.S. Dollars
2008
North America Europe Asia Other Total
(3) Sales to Foreign Customers
The sales to foreign customers of the Company and subsidiaries for the years ended March 31, 2008, 2007 and 2006 are summarized as follows:
HOYA ANNUAL REPORT 2008 81