Pentax 2008 Annual Report Download - page 46
Download and view the complete annual report
Please find page 46 of the 2008 Pentax annual report below. You can navigate through the pages in the report by either clicking on the pages listed below, or by using the keyword search tool below to find specific information within the annual report.-
 1
1 -
2
-
3
-
4
-
5
-
6
-
7
-
8
-
9
-
10
-
11
-
12
-
13
-
14
-
15
-
16
-
17
-
18
-
19
-
20
-
21
-
22
-
23
-
24
-
25
-
26
-
27
-
28
-
29
-
30
-
31
-
32
-
33
-
34
-
35
-
 36
36 -
 37
37 -
 38
38 -
 39
39 -
 40
40 -
 41
41 -
 42
42 -
 43
43 -
 44
44 -
 45
45 -
 46
46 -
 47
47 -
 48
48 -
 49
49 -
 50
50 -
 51
51 -
 52
52 -
 53
53 -
 54
54 -
 55
55 -
 56
56 -
57
-
58
-
59
-
60
-
61
-
62
-
63
-
64
-
65
-
66
-
67
-
68
-
69
-
70
-
71
-
72
-
73
-
74
-
75
-
76
-
77
-
78
-
79
-
80
-
81
-
82
-
83
-
84
-
85
-
86
-
87
-
88
-
89
-
90
-
91
-
92
 |
 |

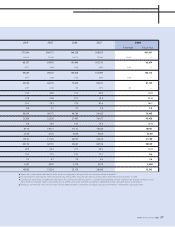
126,338
20,653
16.3
112,379
7,728
9,434
119,808
21,167
17.7
118,229
7,405
11,672
46,177
10,166
22.0
24,416
1,311
848
40,850
9,215
22.6
24,410
1,170
2,119
35,484
6,859
19.3
19,927
855
2,391
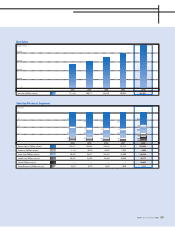
60,000
45,000
30,000
15,000
0
20
15
10
5
0
Net sales
(Millions of yen)
Operating income
(Millions of yen)
Operating
margin (%)
Assets
(Millions of yen)
Depreciation
(Millions of yen)
Capital expenditures
(Millions of yen)
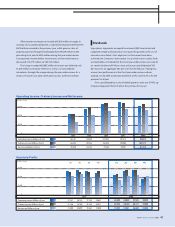
104,457
20,370
19.5
98,243
6,444
7,958
2006 2007 2008
(Millions of yen)
20
15
10
5
0
(%)
120,000
90,000
60,000
30,000
0
Note: The operating margin above is calculated using net sales plus intersegment sales. Please
refer to details on page 78, Segment Information.
Net sales
(Millions of yen)
Operating income
(Millions of yen)
Operating
margin (%)
Assets
(Millions of yen)
Depreciation
(Millions of yen)
Capital expenditures
(Millions of yen)
Note: The operating margin above is calculated using net sales plus intersegment sales. Please
refer to details on page 78, Segment Information.
(%)(Millions of yen)
2006 2007 2008
Management’s Discussion and Analysis
Eye Care (Health Care Division)
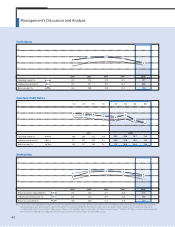
Net sales in the Vision Care Division rose 5.5%, to ¥126,338 million.
Sales in Japan were down 4.8%, as the market continued to contract.
Also, although sales of Hoya’s high-end eyeglass lenses rose, prices
were affected by downward pressure resulting from stiff competition
for low-end lenses. In Europe, the deceleration in consumer demand
grew more pronounced in the second half of the fiscal year, but by
focusing on high-value-added products throughout the fiscal year
Hoya succeeded in increasing sales in this market 10.0% year on year.
Asia-Pacific sales in this division surged 20.0%, as the Company met
expanding regional demand for high-value-added products. North
American sales remained flat, as the subprime loan issue prompted an
economic slowdown and affected the propensity to consume.
Operating income in this division declined 2.4% during the year, to
¥20,653 million, and the operating margin came to 16.3%. This
decrease in profitability was attributable partly to our aggressive
marketing activities targeting eyeglass stores in Japan and overseas,
which we view as an investment in future growth, as well as to
expenditures on upgrades to maintain cutting-edge factories in Asia.
Capital expenditures in this division were down 19.2% from the
preceding term, to ¥9,434 million. This investment went toward IT
systems linking Hoya’s plants with customers’ eyeglass stores, as well as
efforts to raise production system efficiency.
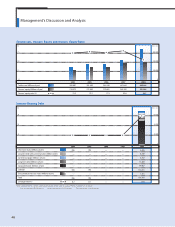
Net sales in the Health Care Division rose 13.0% from the previous year,
to ¥46,177 million. Heightened efforts to attract customers to our Eye
City chain of directly managed contact lens specialty stores through
consulting-based sales and enhanced after-sales services succeeded in
raising store sales even though the overall number of stores in the chain
decreased. Boosting sales in Japan and overseas were highly regarded
products such as soft yellow lenses—post-cataract-surgery IOLs.
The division’s operating income increased 10.3% during the year,
to ¥10,166 million, and its operating margin came to 22.0%. Although
the operating environment remained adverse, Hoya maintained
profitability through aggressive investment in marketing to ensure
future growth on the one hand, while cutting operating costs on the
other.
Eye Care (Vision Care Division)
44