Pentax 2008 Annual Report Download - page 43
Download and view the complete annual report
Please find page 43 of the 2008 Pentax annual report below. You can navigate through the pages in the report by either clicking on the pages listed below, or by using the keyword search tool below to find specific information within the annual report.-
 1
1 -
2
-
3
-
4
-
5
-
6
-
7
-
8
-
9
-
10
-
11
-
12
-
13
-
14
-
15
-
16
-
17
-
18
-
19
-
20
-
21
-
22
-
23
-
24
-
25
-
26
-
27
-
28
-
29
-
30
-
31
-
32
-
 33
33 -
 34
34 -
 35
35 -
 36
36 -
 37
37 -
 38
38 -
 39
39 -
 40
40 -
 41
41 -
 42
42 -
 43
43 -
 44
44 -
 45
45 -
 46
46 -
 47
47 -
 48
48 -
 49
49 -
 50
50 -
 51
51 -
 52
52 -
 53
53 -
54
-
55
-
56
-
57
-
58
-
59
-
60
-
61
-
62
-
63
-
64
-
65
-
66
-
67
-
68
-
69
-
70
-
71
-
72
-
73
-
74
-
75
-
76
-
77
-
78
-
79
-
80
-
81
-
82
-
83
-
84
-
85
-
86
-
87
-
88
-
89
-
90
-
91
-
92
 |
 |
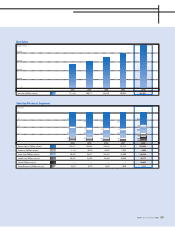
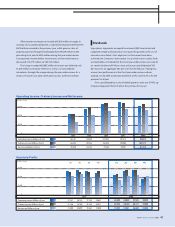
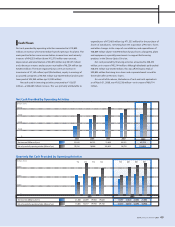
Operating income (Millions of yen)
Ordinary income (Millions of yen)
Net income (Millions of yen)
95,074
100,175
81,725
107,213
102,909
83,391
101,096
103,638
75,620
2006 2007 2008
(Millions of yen)
84,920
89,525
64,135
2005
68,167
66,554
39,549
2004
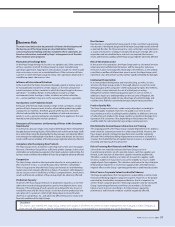
Operating income (Millions of yen)
Ordinary income (Millions of yen)
Net income (Millions of yen)
2008
(Millions of yen)
2007
27,241
25,140
21,500
28,125
25,700
22,899
27,216
25,148
19,964
24,631
26,921
19,028
22,640
23,976
17,097
26,850
28,120
21,021
27,525
28,171
22,603
18,059
19,908
21,004
1Q 2Q 3Q 4Q 1Q 2Q 3Q 4Q
Quarterly Profits
90,000
60,000
30,000
0
30,000
20,000
10,000
0
Operating Income, Ordinary Income and Net Income
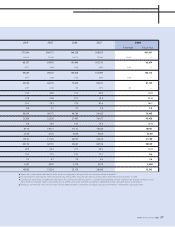
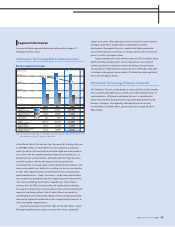
Other income and expenses included ¥5,926 million in equity in
earnings of associated companies, a substantial improvement from the
¥642 million recorded in the previous year, while gain on sales of
property, plant and equipment plunged from ¥9,629 million in the
preceding fiscal year to ¥520 million during the year under review.
Consequently, income before income taxes and minority interests
decreased ¥12,579 million, to ¥94,553 million.
The Group recorded ¥20,083 million in income tax–deferred and
¥1,639 million in minority interests in net loss of consolidated
subsidiaries through the merger during the year under review. As a
result, net income was down 2.0% year on year, to ¥81,725 million.
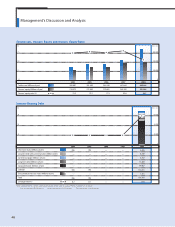
Hoya places top priority on capital investment, R&D investment and
corporate merger and acquisition in its quest for growth on the use of
internal reserve funds. Once objectives in these areas have been
achieved, the Company’s basic policy is to actively return surplus funds
to shareholders. Dividends for the fiscal year under review consisted of
an interim dividend of ¥30 per share and a year-end dividend of ¥35
per share, for an aggregate ¥65 per share for the full year. Taking into
account our performance in the fiscal year under review and our
outlook, we decided to maintain dividends at the same level as for the
previous fiscal year.
On a consolidated basis, the dividend payment ratio was 34.4%, up
0.8 percentage point from 33.6% in the previous fiscal year.
Dividends
HOYA ANNUAL REPORT 2008 41