Pentax 2008 Annual Report Download - page 64
Download and view the complete annual report
Please find page 64 of the 2008 Pentax annual report below. You can navigate through the pages in the report by either clicking on the pages listed below, or by using the keyword search tool below to find specific information within the annual report.-
 1
1 -
2
-
3
-
4
-
5
-
6
-
7
-
8
-
9
-
10
-
11
-
12
-
13
-
14
-
15
-
16
-
17
-
18
-
19
-
20
-
21
-
22
-
23
-
24
-
25
-
26
-
27
-
28
-
29
-
30
-
31
-
32
-
33
-
34
-
35
-
36
-
37
-
38
-
39
-
40
-
41
-
42
-
43
-
44
-
45
-
46
-
47
-
48
-
49
-
50
-
51
-
52
-
53
-
 54
54 -
 55
55 -
 56
56 -
 57
57 -
 58
58 -
 59
59 -
 60
60 -
 61
61 -
 62
62 -
 63
63 -
 64
64 -
 65
65 -
 66
66 -
 67
67 -
 68
68 -
 69
69 -
 70
70 -
 71
71 -
 72
72 -
 73
73 -
 74
74 -
75
-
76
-
77
-
78
-
79
-
80
-
81
-
82
-
83
-
84
-
85
-
86
-
87
-
88
-
89
-
90
-
91
-
92
 |
 |
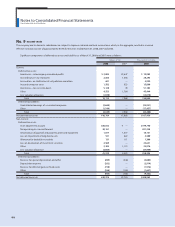
$36,091
13,056
$49,147
2008 2007 2008
Marketable equity securities
Non-marketable equity securities
Total
¥3,616
1,308
¥4,924
¥1,542
1,356
¥2,898
Thousands of U.S. DollarsMillions of Yen
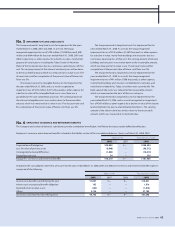
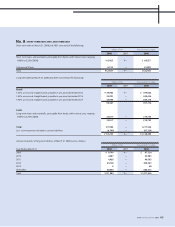
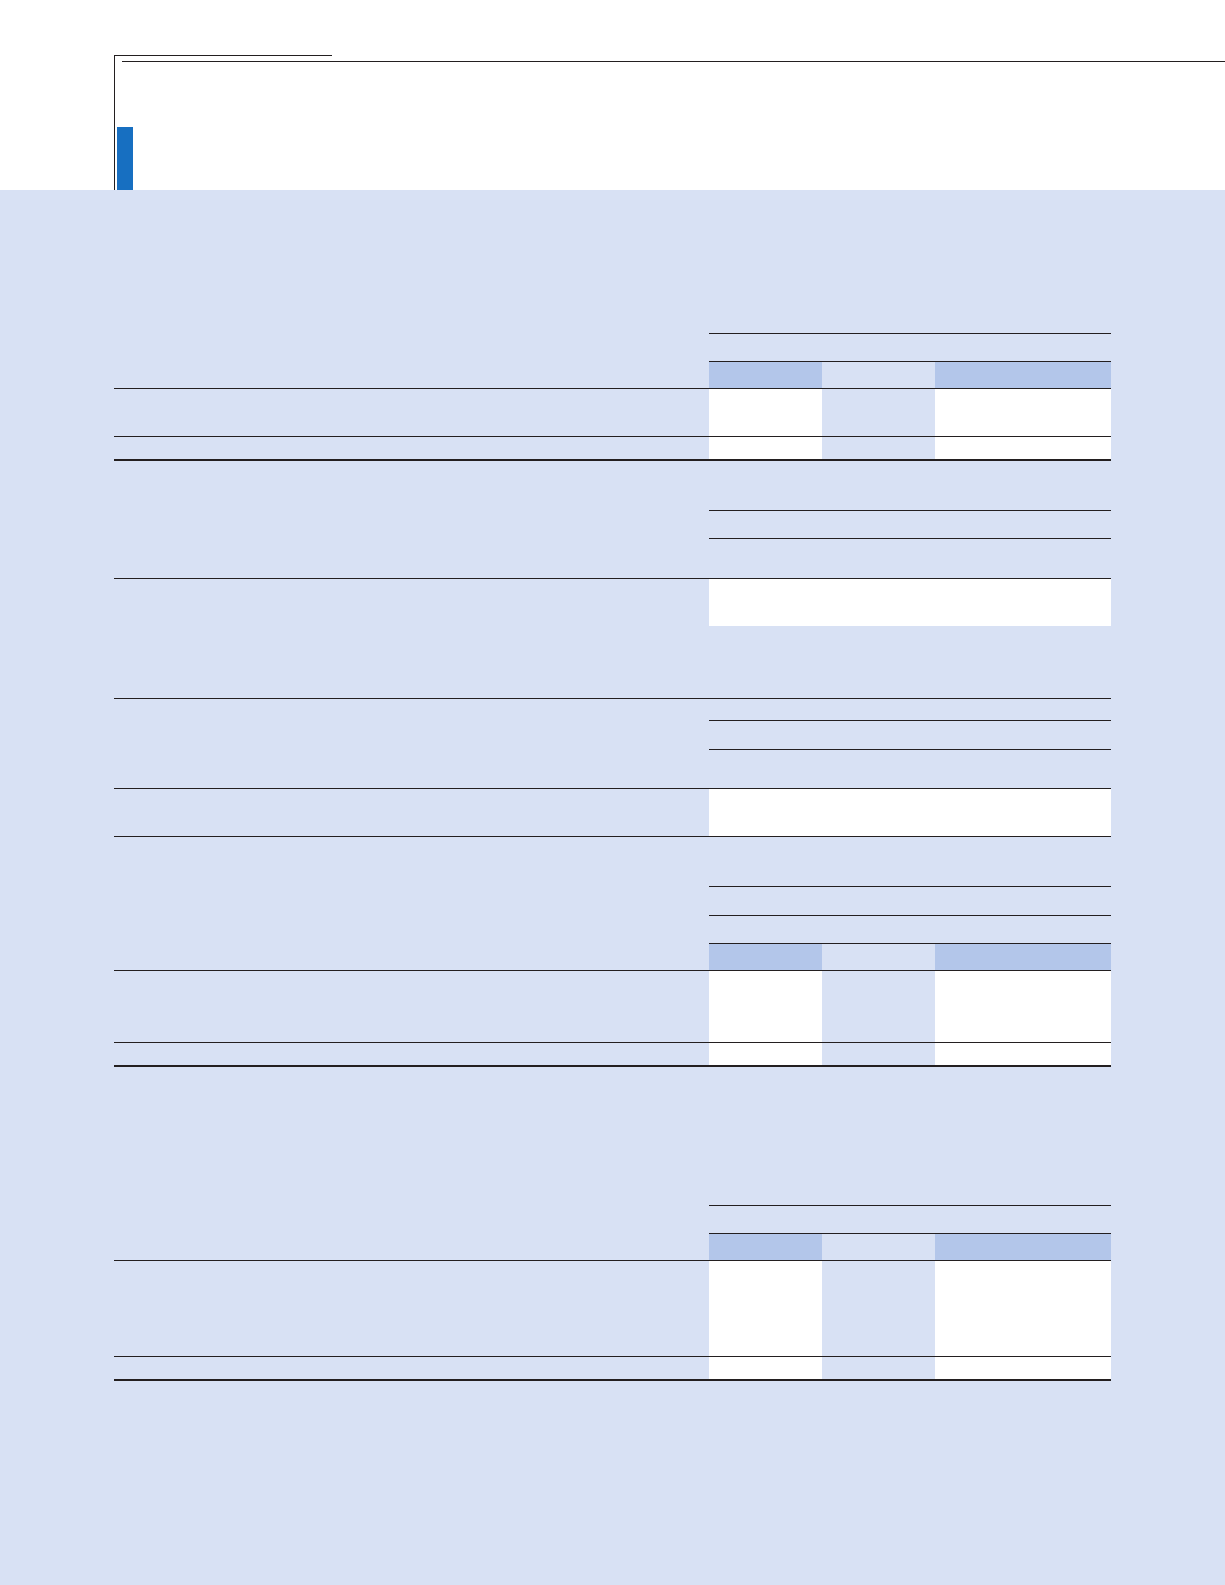
No. 3 INVESTMENT SECURITIES
$10,580
2,476
172,462
$185,518
2008 2007 2008
Equity securities
Investment to limited partnership and others
Investment in unconsolidated subsidiaries and affiliated companies
Total
¥1,060
248
17,279
¥18,587
¥1,100
256
11,678
¥13,034
Thousands of U.S. DollarsMillions of Yen
Carrying Amount
March 31, 2008
Available-for-sale—Equity securities
March 31, 2007
Available-for-sale—Equity securities
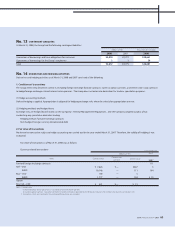
¥4,677
¥1,693
¥—
¥—
¥1,061
¥ 151
¥3,616
¥1,542
Millions of Yen
Fair ValueCost Unrealized Gains Unrealized
Losses
March 31, 2008
Available-for-sale—Equity securities $46,681 $— $10,590 $36,091
Thousands of U.S. Dollars
Fair ValueCost Unrealized Gains Unrealized
Losses
$322,287
233,157
109,662
161,543
$826,649
2008 2007 2008
Finished products and merchandise
Semi-finished products and work in process
Raw materials
Supplies
Total
¥32,290
23,360
10,987
16,185
¥82,822
¥17,453
10,069
9,498
12,702
¥49,722
Thousands of U.S. DollarsMillions of Yen
No. 4 INVENTORIES
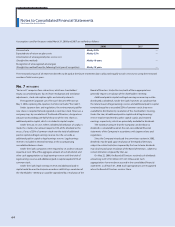
Notes to Consolidated Financial Statements
Hoya Corporation and Subsidiaries
Investment securities as of March 31, 2008 and 2007 consisted of the following:
Available-for-sale securities whose fair value was not readily determinable as of March 31, 2008 and 2007 were as follows:
The carrying amounts and aggregate fair values of marketable equity securities at March 31, 2008 and 2007 were as follows:
These were no sales of available-for-sale securities for the years ended March 31, 2008 and 2007.
Inventories as of March 31, 2008 and 2007 consisted of the following:
62