Pentax 2008 Annual Report Download - page 81
Download and view the complete annual report
Please find page 81 of the 2008 Pentax annual report below. You can navigate through the pages in the report by either clicking on the pages listed below, or by using the keyword search tool below to find specific information within the annual report.-
 1
1 -
2
-
3
-
4
-
5
-
6
-
7
-
8
-
9
-
10
-
11
-
12
-
13
-
14
-
15
-
16
-
17
-
18
-
19
-
20
-
21
-
22
-
23
-
24
-
25
-
26
-
27
-
28
-
29
-
30
-
31
-
32
-
33
-
34
-
35
-
36
-
37
-
38
-
39
-
40
-
41
-
42
-
43
-
44
-
45
-
46
-
47
-
48
-
49
-
50
-
51
-
52
-
53
-
54
-
55
-
56
-
57
-
58
-
59
-
60
-
61
-
62
-
63
-
64
-
65
-
66
-
67
-
68
-
69
-
70
-
 71
71 -
 72
72 -
 73
73 -
 74
74 -
 75
75 -
 76
76 -
 77
77 -
 78
78 -
 79
79 -
 80
80 -
 81
81 -
 82
82 -
 83
83 -
 84
84 -
 85
85 -
 86
86 -
 87
87 -
 88
88 -
 89
89 -
 90
90 -
 91
91 -
92
 |
 |
Assets
Depreciation
Impairment loss
Capital expenditures
$80,217
1,376
—
$ 1,413
$2,096,087
276,007
—
$ 243,843
$1,121,659
77,129
611
$ 94,165
$243,697
13,085
2,116
$ 8,463
$2,044,645
78,409
1,790
$ 44,463
$28,127
471
1,288
$ 1,455
$5,614,432
446,477
5,805
$ 393,802
$1,266,933
1,432
—
$ 103
$6,881,365
447,909
5,805
$ 393,905
Thousands of U.S. Dollars
2008
Information
Technology
Electro-Optics Photonics Vision Care Health Care
Eye Care Pentax Other
Businesses Total
Eliminations
and
Corporate
Consolidated
Sales to customers
Intersegment sales
Total sales
Operating expenses
Operating income (loss)
¥10,093
246
10,339
9,405
¥ 934
¥190,552
744
191,296
116,434
¥ 74,862
¥104,457
1
104,458
84,088
¥ 20,370
¥35,484
0
35,484
28,625
¥6,859
¥1,864
33
1,897
2,052
¥ (155)
¥1,778
4,333
6,111
5,464
¥647
¥344,228
5,357
349,585
246,068
¥103,517
¥ —
(5,357)
(5,357)
(2,936)
¥(2,421)
¥344,228
—
344,228
243,132
¥101,096
Millions of Yen
2006
Information
Technology
Electro-Optics Photonics Vision Care Health Care Crystal Service
Eye Care Lifestyle
Refinement Total
Eliminations
and
Corporate
Consolidated
Sales to customers
Intersegment sales
Total sales
Operating expenses
Operating income (loss)
¥9,093
248
9,341
8,851
¥ 490
¥219,252
414
219,666
139,581
¥ 80,085
¥119,808
0
119,808
98,641
¥ 21,167
¥40,850
0
40,850
31,635
¥ 9,215
¥1,090
2,766
3,856
4,206
¥ (350)
¥390,093
3,428
393,521
282,914
¥110,607
¥ —
(3,428)
(3,428)
(34)
¥(3,394)
¥390,093
—
390,093
282,880
¥107,213
Millions of Yen
2007
Information
Technology
Electro-Optics Photonics Vision Care Health Care
Eye Care Other
Businesses Total
Eliminations
and
Corporate
Consolidated
Assets
Depreciation
Impairment loss
Capital expenditures
¥7,761
125
—
155
¥258,746
27,449
—
39,899
¥118,229
7,405
—
11,672
¥24,410
1,170
—
2,119
¥2,518
45
88
90
¥411,664
36,194
88
53,935
¥35,980
145
—
497
¥447,644
36,339
88
54,432
Millions of Yen
2007
Information
Technology
Electro-Optics Photonics Vision Care Health Care
Eye Care Other
Businesses Total
Eliminations
and
Corporate
Consolidated
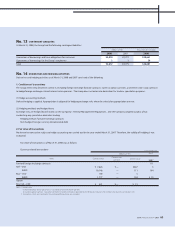
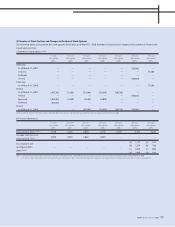
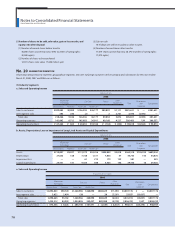
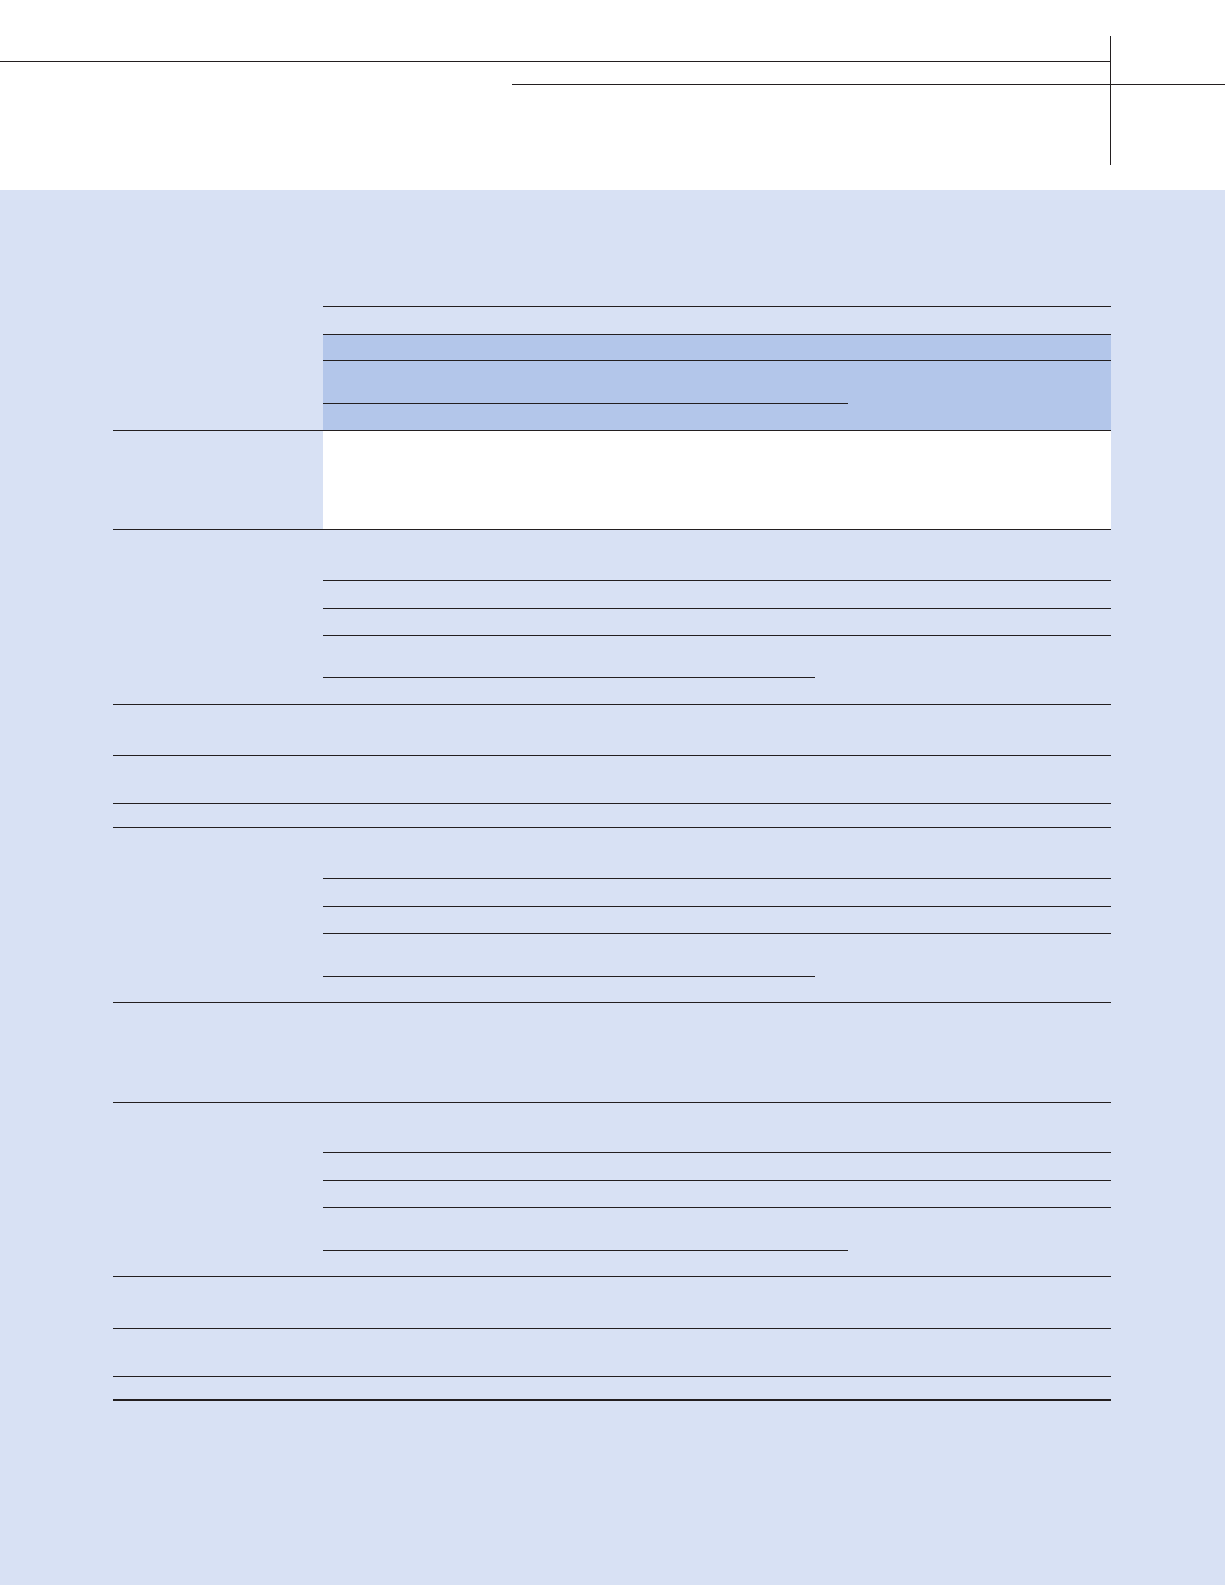
b. Assets, Depreciation, Loss on Impairment of Long-Lived Assets and Capital Expenditures
a. Sales and Operating Income
a. Sales and Operating Income
b. Assets, Depreciation, Loss on Impairment of Long-Lived Assets and Capital Expenditures
HOYA ANNUAL REPORT 2008 79