Pentax 2008 Annual Report Download - page 3
Download and view the complete annual report
Please find page 3 of the 2008 Pentax annual report below. You can navigate through the pages in the report by either clicking on the pages listed below, or by using the keyword search tool below to find specific information within the annual report.-
 1
1 -
 2
2 -
 3
3 -
 4
4 -
 5
5 -
 6
6 -
 7
7 -
 8
8 -
 9
9 -
 10
10 -
 11
11 -
 12
12 -
 13
13 -
 14
14 -
15
-
16
-
17
-
18
-
19
-
20
-
21
-
22
-
23
-
24
-
25
-
26
-
27
-
28
-
29
-
30
-
31
-
32
-
33
-
34
-
35
-
36
-
37
-
38
-
39
-
40
-
41
-
42
-
43
-
44
-
45
-
46
-
47
-
48
-
49
-
50
-
51
-
52
-
53
-
54
-
55
-
56
-
57
-
58
-
59
-
60
-
61
-
62
-
63
-
64
-
65
-
66
-
67
-
68
-
69
-
70
-
71
-
72
-
73
-
74
-
75
-
76
-
77
-
78
-
79
-
80
-
81
-
82
-
83
-
84
-
85
-
86
-
87
-
88
-
89
-
90
-
91
-
92
 |
 |

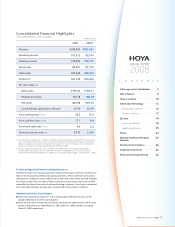
2008*2
2007
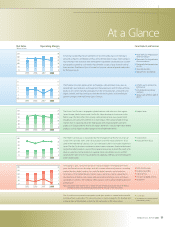
Net sales
Operating income
Ordinary income
Net income
Total assets
Net assets*1
Per share data (Yen)
Net income
Diluted net income
Net assets
Cash dividends applicable to the year
Price earnings ratio (Times)
Price cash flow ratio (Times)
Price book value ratio (Times)
Stock price at year-end (Yen)
¥390,093
107,213
102,909
83,391
447,644
367,145
¥481,631
95,074
100,175
81,725
689,444
394,626
*1 From the fiscal year ended March 31, 2007, the Company has applied “Accounting Standard for Presentation of Net
Assets in the Balance Sheet” (Statement No. 5 issued by the Accounting Standards Board of Japan on December 9,
2005) and “Guidance on Accounting Standard for Presentation of Net Assets in the Balance Sheet” (Guidance No. 8
issued by the Accounting Standards Board of Japan on December 9, 2005).
*2 In August 2007, Pentax Corporation and its subsidiaries were added to the Group’s scope of consolidation.
Therefore, performance figures shown include the results of Pentax Corporation and its subsidiaries from the
second half of the fiscal year ended March 31, 2008 (the six-month period from October 1, 2007, to March 31, 2008).
¥193.50
192.78
845.98
65.00
20.2
17.1
4.6
3,910
¥189.01
188.78
903.49
65.00
12.4
8.4
2.6
2,340
Statements made in this annual report with respect to Hoya’s plans and future performance
that are not historical fact are forward-looking statements. These statements are based on
management’s judgments, plans and forecasts in light of the information currently available
to it. Hoya cautions that a number of factors could cause actual events and results to differ
materially from those discussed in the forward-looking statements. Such factors include but
are not limited to foreign exchange rates, market trends and economic conditions.
Disclaimer Regarding Forward-Looking Statements
Hoya’s fiscal year ends on March 31. In this annual report, references to years are the
period ended March 31 of the year indicated.
In this annual report, “the previous fiscal year,” “the fiscal year under review,” and “the year
ahead” indicate the years ended March 31, 2007, March 31, 2008, and the year ending
March 31, 2009, respectively.
Notation Used in this Annual Report
Years Ended March 31, 2007 and 2008
Consolidated Financial Highlights
2
8
10
12
12
17
18
18
20
23
26
30
32
35
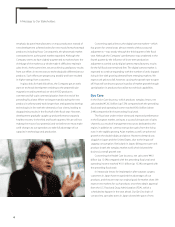
A Message to Our Stakeholders
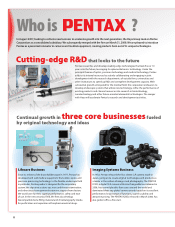
Who is Pentax?
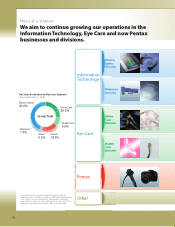
Hoya at a Glance
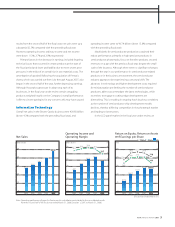
Information Technology
Electro-Optics Division
Photonics Division
Eye Care
Vision Care Division
Health Care Division
Pentax
R&D and Intellectual Property
Activities
Environmental Initiatives
Corporate Governance
Financial and Corporate Data
Contents
(Millions of yen)
HOYA ANNUAL REPORT 2008 1