Pentax 2008 Annual Report Download - page 5
Download and view the complete annual report
Please find page 5 of the 2008 Pentax annual report below. You can navigate through the pages in the report by either clicking on the pages listed below, or by using the keyword search tool below to find specific information within the annual report.-
 1
1 -
 2
2 -
 3
3 -
 4
4 -
 5
5 -
 6
6 -
 7
7 -
 8
8 -
 9
9 -
 10
10 -
 11
11 -
 12
12 -
 13
13 -
 14
14 -
 15
15 -
 16
16 -
17
-
18
-
19
-
20
-
21
-
22
-
23
-
24
-
25
-
26
-
27
-
28
-
29
-
30
-
31
-
32
-
33
-
34
-
35
-
36
-
37
-
38
-
39
-
40
-
41
-
42
-
43
-
44
-
45
-
46
-
47
-
48
-
49
-
50
-
51
-
52
-
53
-
54
-
55
-
56
-
57
-
58
-
59
-
60
-
61
-
62
-
63
-
64
-
65
-
66
-
67
-
68
-
69
-
70
-
71
-
72
-
73
-
74
-
75
-
76
-
77
-
78
-
79
-
80
-
81
-
82
-
83
-
84
-
85
-
86
-
87
-
88
-
89
-
90
-
91
-
92
 |
 |

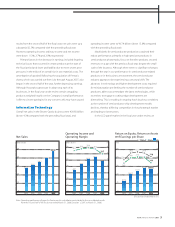
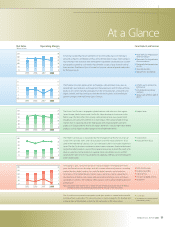
Net Sales
Operating Income and
Operating Margin
Return on Equity, Return on Assets
and Earnings per Share
(Billions of yen) (Billions of yen) (Yen) (%)(%)
Note: Operating performance figures for Pentax and its subsidiaries are included in the consolidated results
from the second half of the fiscal year ended March 31, 2008 (October 1, 2007, to March 31, 2008).
(Fiscal years ended March 31)
2005 2006 2007
2008
2004
500
400
300
200
100
0
271.4
308.1
344.2
390.0
481.6
2005 2006 2007
2008
2004
140
120
100
80
60
40
20
0
30
20
10
0
68.1
101.0 107.2 20.0 21.2
14.0
87.74
144.71
189.01
14.4
20.6
2005 2006 2007
2008
2004
25.8 25.9
21.6
30
20
10
0
350
280
210
140
70
0
29.4
19.7
EPSROE ROA
84.9
171.71
27.1
17.8
193.50
95.0
25.1 27.6 27.5
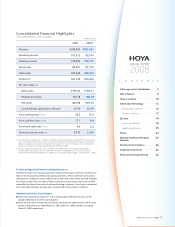
results from the second half of the fiscal year, net sales were up a
substantial 23.5% compared with the preceding fiscal year.
However, operating income, ordinary income and net income
were down 11.3%, 2.7% and 2.0%, respectively.
Primary factors in the decrease in earnings included lingering
technical issues that occurred in certain products at the start of
the fiscal period and lower profitability due to more severe price
pressures in the midst of an overall rise in raw materials costs. The
amortization of goodwill following the acquisition of Pentax’s
shares, which was carried out from July through August 2007, also
began in the second half of the year, further depressing earnings.
Although Hoya takes great care in advancing each of its
businesses, in the fiscal year under review certain struggling
products weighed heavily on the Company’s overall performance.
I offer my sincere apologies for any concerns this may have caused.
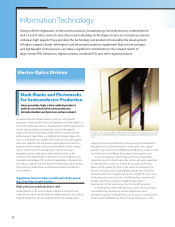
Information Technology
Overall net sales in the Electro-Optics business were ¥209.8 billion
(down 4.3% compared with the preceding fiscal year), and
operating income came to ¥67.4 billion (down 15.8% compared
with the preceding fiscal year).
Mask blanks for semiconductor production sustained their
robust performance, primarily in high-precision products. In
semiconductor photomasks, focus on frontline products secured
revenues on a par with the previous fiscal year, despite the small
scale of the business. Although there were no significant changes
through the year in our performance in semiconductor-related
products or in the business environment, the semiconductor
industry appears to be experiencing a structural shift. The
advances in technology and higher development costs required
for miniaturization are limiting the number of semiconductor
producers able to accommodate the latest technologies, while
incentives to engage in cutting-edge development are
diminishing. This is resulting in ongoing harsh business conditions
as the number of semiconductor chip development models
declines, thereby stiffening competition in the photomask market
and leading to lower prices.
In the LCD panel market in the fiscal year under review, an
HOYA ANNUAL REPORT 2008 3