Pentax 2008 Annual Report Download - page 56
Download and view the complete annual report
Please find page 56 of the 2008 Pentax annual report below. You can navigate through the pages in the report by either clicking on the pages listed below, or by using the keyword search tool below to find specific information within the annual report.-
 1
1 -
2
-
3
-
4
-
5
-
6
-
7
-
8
-
9
-
10
-
11
-
12
-
13
-
14
-
15
-
16
-
17
-
18
-
19
-
20
-
21
-
22
-
23
-
24
-
25
-
26
-
27
-
28
-
29
-
30
-
31
-
32
-
33
-
34
-
35
-
36
-
37
-
38
-
39
-
40
-
41
-
42
-
43
-
44
-
45
-
 46
46 -
 47
47 -
 48
48 -
 49
49 -
 50
50 -
 51
51 -
 52
52 -
 53
53 -
 54
54 -
 55
55 -
 56
56 -
 57
57 -
 58
58 -
 59
59 -
 60
60 -
 61
61 -
 62
62 -
 63
63 -
 64
64 -
 65
65 -
 66
66 -
67
-
68
-
69
-
70
-
71
-
72
-
73
-
74
-
75
-
76
-
77
-
78
-
79
-
80
-
81
-
82
-
83
-
84
-
85
-
86
-
87
-
88
-
89
-
90
-
91
-
92
 |
 |
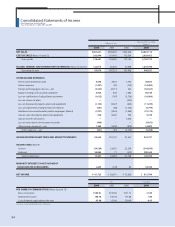
$4,807,176
2,624,453
2,182,723
1,233,786
948,937
45,873
(14,482)
(54,367)
59,148
(16,089)
—
(11,229)
(5,799)
(19,174)
5,190
—
(9,073)
14,802
(5,200)
943,737
(344,845)
200,449
144,396
16,359
$ 815,700
$1.89
1.88
0.65
2008 20062007 2008
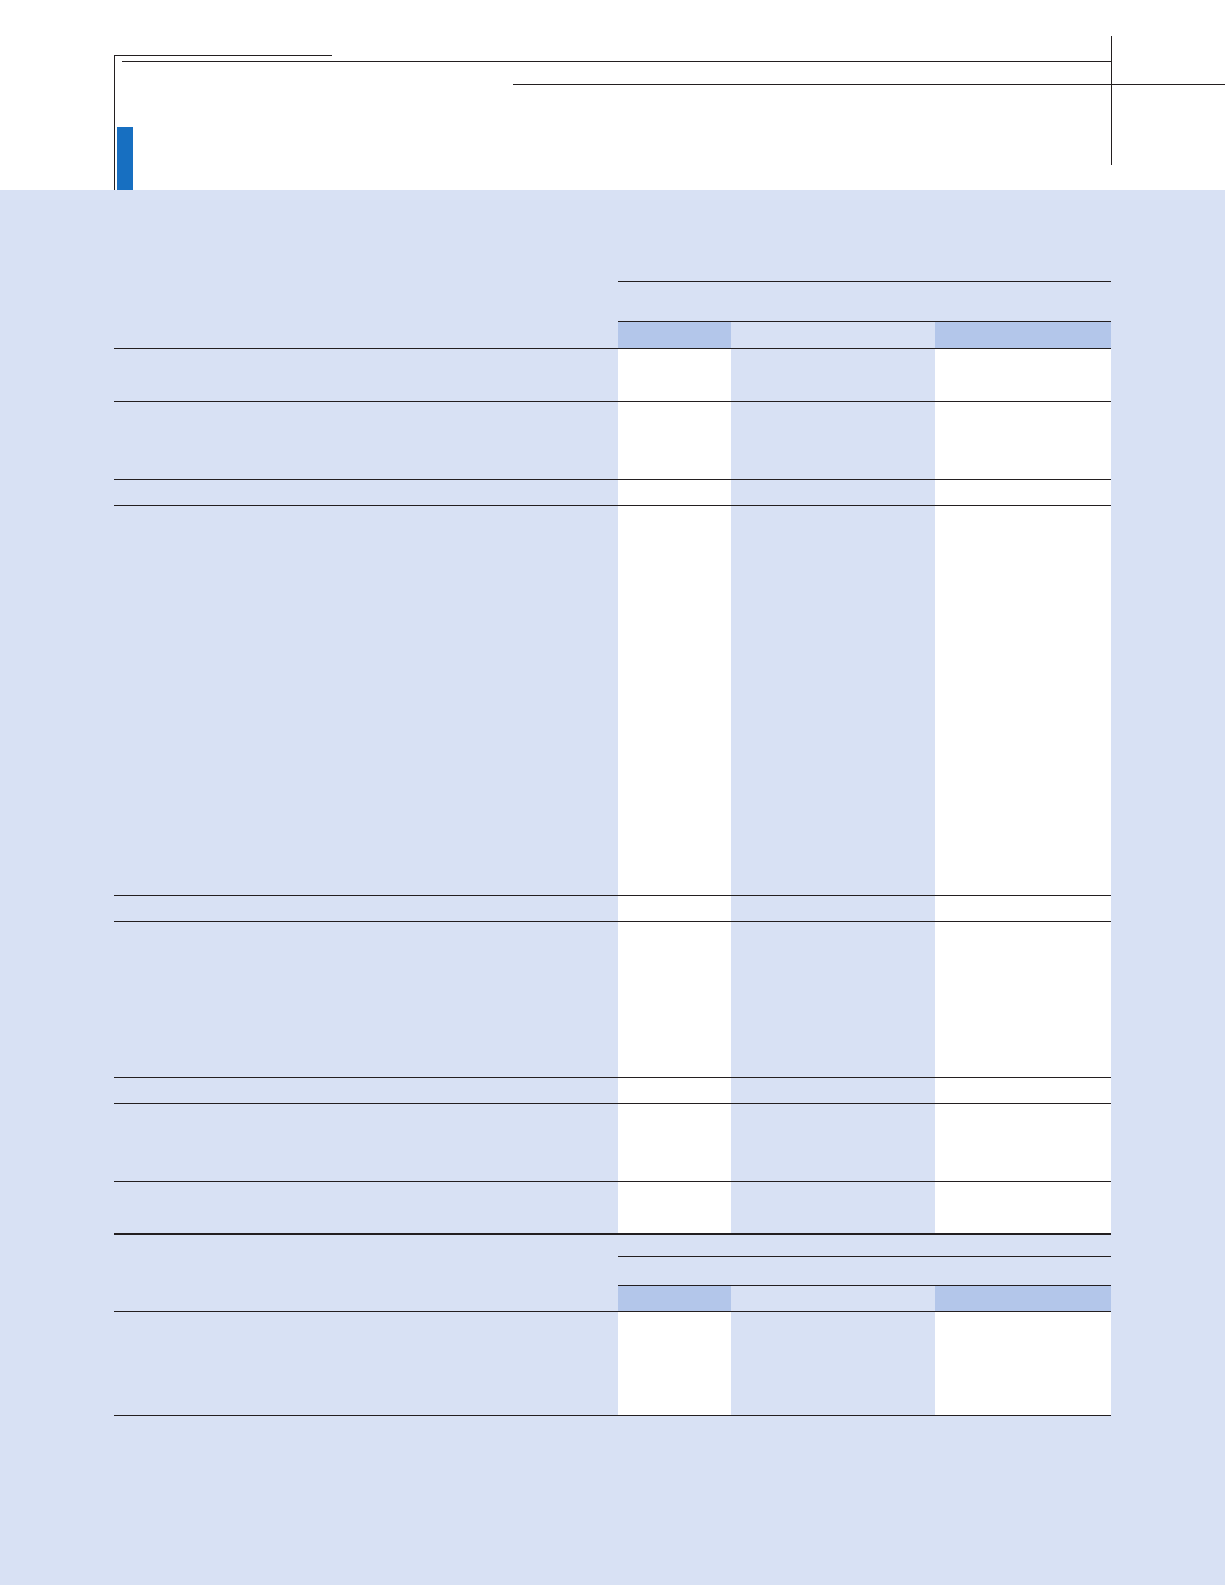
NET SALES
COST OF SALES (Notes 10 and 12)
Gross profit
SELLING, GENERAL AND ADMINISTRATIVE EXPENSES (Notes 10 and 12)
Operating income
OTHER INCOME (EXPENSES):
Interest and dividend income
Interest expense
Foreign exchange gains (losses)—net
Equity in earnigs of associated companies
Loss on clarification of soil pollution and others
Loss on closure of plant
Loss on disposal of property, plant and equipment
Loss on impairment of long-lived assets (Note 5)
Additional retirement benefits paid to employees (Note 6)
Gain on sales of property, plant and equipment
Gain on transfer of business
Loss on write-down of investment securities
Other income (expense)—net
Other expenses—net
INCOME BEFORE INCOME TAXES AND MINORITY INTERESTS
INCOME TAXES (Note 9)
Current
Deferred
Total income taxes
MIINORITY INTERESTS IN NET INCOME OF
CONSOLIDATED SUBSIDIARIES
NET INCOME
PER SHARE OF COMMON STOCK (Notes 2.p and 15)
Basic net income
Diluted net income
Cash dividends applicable to the year
¥481,631
262,944
218,687
123,613
95,074
4,596
(1,451)
(5,447)
5,926
(1,612)
—
(1,125)
(581)
(1,921)
520
—
(909)
1,483
(521)
94,553
(34,550)
20,083
14,467
1,639
¥ 81,725
¥189.01
188.78
65.00
¥344,228
172,034
172,194
71,098
101,096
1,795
(142)
243
1,285
(3,726)
(523)
(625)
(1,233)
(1,689)
109
1,656
—
(879)
(3,729)
97,367
22,250
(512)
21,738
(9)
¥ 75,620
¥171.71
171.08
150.00
¥390,093
197,410
192,683
85,470
107,213
2,922
(87)
(6,711)
642
(767)
—
(3,327)
(88)
(1,055)
9,629
—
—
(1,239)
(81)
107,132
23,492
71
23,563
(178)
¥ 83,391
¥193.50
192.78
65.00
Thousands of U.S. Dollars
(Note 1)
Millions of Yen
2008 20062007 2008
U.S. DollarsYen
See notes to consolidated financial statements.
Consolidated Statements of Income
Hoya Corporation and Subsidiaries
Years Ended March 31, 2008, 2007 and 2006
54