Pentax 2008 Annual Report Download - page 59
Download and view the complete annual report
Please find page 59 of the 2008 Pentax annual report below. You can navigate through the pages in the report by either clicking on the pages listed below, or by using the keyword search tool below to find specific information within the annual report.-
 1
1 -
2
-
3
-
4
-
5
-
6
-
7
-
8
-
9
-
10
-
11
-
12
-
13
-
14
-
15
-
16
-
17
-
18
-
19
-
20
-
21
-
22
-
23
-
24
-
25
-
26
-
27
-
28
-
29
-
30
-
31
-
32
-
33
-
34
-
35
-
36
-
37
-
38
-
39
-
40
-
41
-
42
-
43
-
44
-
45
-
46
-
47
-
48
-
 49
49 -
 50
50 -
 51
51 -
 52
52 -
 53
53 -
 54
54 -
 55
55 -
 56
56 -
 57
57 -
 58
58 -
 59
59 -
 60
60 -
 61
61 -
 62
62 -
 63
63 -
 64
64 -
 65
65 -
 66
66 -
 67
67 -
 68
68 -
 69
69 -
70
-
71
-
72
-
73
-
74
-
75
-
76
-
77
-
78
-
79
-
80
-
81
-
82
-
83
-
84
-
85
-
86
-
87
-
88
-
89
-
90
-
91
-
92
 |
 |

$943,737
447,909
5,559
11,299
1,258
(5,180)
11,229
5,809
8,703
(21,170)
—
(59,148)
—
117,347
62,421
(71,494)
10,370
(31,640)
9,153
(45,863)
14,483
44,106
(13,943)
(249,127)
252,081
1,195,818
269
—
(723,256)
12,137
(388,152)
—
4,781
(34,005)
(1,128,226)
2008 20062007 2008
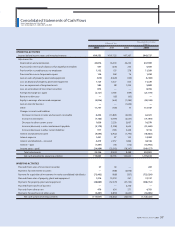
OPERATING ACTIVITIES
Income before income taxes and minority interests
Adjustment for
Depreciation and amortization
Provision for (reversal of) allowance for doubtful receivables
Provision for accrued bonuses to employees
Provision for reserve for periodic repairs
Gain on sales of property, plant and equipment
Loss on disposal of property, plant and equipment
Loss on impairment of long-lived assets
Loss on write-down of investment securities
Foreign exchange loss (gain)
Bonuses to directors
Equity in earnings of associated companies
Gain on transfer business
Other
Changes in assets and liabilities
Decrease (increase) in notes and accounts receivable
Increase in inventories
Decrease in other current assets
Increase (decrease) in notes and accounts payable
Increase (decrease) in other current liabilities
Interest and dividend income
Interest expense
Interest and dividends—received
Interest—paid
Income taxes—paid
Total adjustments
Net cash provided by operating activities
INVESTING ACTIVITIES
Proceeds from sales of investment securities
Payments for investment securities
Payment for acquisition of investments in newly consolidated subsidiaries
Proceeds from sales of property, plant and equipment
Payments for property, plant and equipment
Proceeds from transfer of business
Proceeds from other assets
Payments for purchases of other assets
Net cash used in investing activities
¥94,553
44,876
557
1,132
126
(519)
1,125
582
872
(2,121)
—
(5,926)
—
11,757
6,254
(7,163)
1,039
(3,170)
917
(4,595)
1,451
4,419
(1,397)
(24,960)
25,256
119,809
27
—
(72,463)
1,216
(38,889)
—
479
(3,407)
(113,037)
¥97,367
26,252
235
278
76
(109)
625
1,233
—
(599)
(65)
(1,285)
(1,656)
77
(4,042)
(2,547)
2,097
3,644
2,420
(1,795)
142
1,866
(112)
(18,247)
8,488
105,855
—
(2,070)
(337)
267
(47,742)
2,230
271
(4,632)
(52,013)
¥107,132
36,339
(243)
155
268
(9,629)
3,327
88
—
4,783
(65)
(642)
—
(700)
(13,801)
(4,799)
2,250
(1,208)
(781)
(2,922)
87
2,557
(41)
(23,362)
(8,339)
98,793
30
(408)
(908)
10,218
(52,379)
—
654
(3,859)
(46,652)
Thousands of U.S. Dollars
(Note 1)
Millions of Yen
Consolidated Statements of Cash Flows
Hoya Corporation and Subsidiaries
Years Ended March 31, 2008, 2007 and 2006
57HOYA ANNUAL REPORT 2008