Pentax 2008 Annual Report Download - page 42
Download and view the complete annual report
Please find page 42 of the 2008 Pentax annual report below. You can navigate through the pages in the report by either clicking on the pages listed below, or by using the keyword search tool below to find specific information within the annual report.-
 1
1 -
2
-
3
-
4
-
5
-
6
-
7
-
8
-
9
-
10
-
11
-
12
-
13
-
14
-
15
-
16
-
17
-
18
-
19
-
20
-
21
-
22
-
23
-
24
-
25
-
26
-
27
-
28
-
29
-
30
-
31
-
 32
32 -
 33
33 -
 34
34 -
 35
35 -
 36
36 -
 37
37 -
 38
38 -
 39
39 -
 40
40 -
 41
41 -
 42
42 -
 43
43 -
 44
44 -
 45
45 -
 46
46 -
 47
47 -
 48
48 -
 49
49 -
 50
50 -
 51
51 -
 52
52 -
53
-
54
-
55
-
56
-
57
-
58
-
59
-
60
-
61
-
62
-
63
-
64
-
65
-
66
-
67
-
68
-
69
-
70
-
71
-
72
-
73
-
74
-
75
-
76
-
77
-
78
-
79
-
80
-
81
-
82
-
83
-
84
-
85
-
86
-
87
-
88
-
89
-
90
-
91
-
92
 |
 |

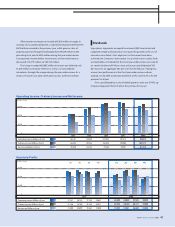
2006 2007 2008
(% of total)
20052004
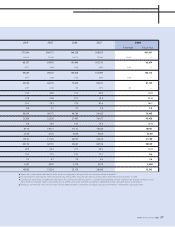
Japan (Millions of yen)
Asia and Other Areas (Millions of yen)
Europe (Millions of yen)
North America (Millions of yen)
148,325
44,668
40,168
38,283
166,414
61,808
36,430
43,520
173,506
86,848
41,201
42,673
178,547
113,068
53,524
44,954
Japan (Millions of yen)
Asia (Millions of yen)
Europe (Millions of yen)
North America (Millions of yen)
291,566
43,965
89,420
56,680
270,373
30,928
51,336
37,456
244,998
24,527
39,232
35,471
2006 2007 2008
(% of total)
230,946
12,648
33,803
30,775
2005
188,441
12,404
37,486
33,113
2004
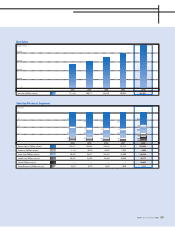
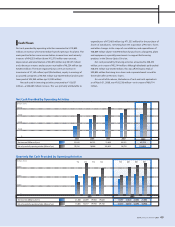
Sales by Region (Based on the location of the Company’s offices)
100
75
50
25
0
100
75
50
25
012.2
13.8
4.6
69.4
10.0 10.3 9.6 11.8
18.6
9.1
60.5
13.2
7.9
69.3
11.4
7.1
71.2
11.0
4.1
74.9
188,520
141,701
92,116
59,294
14.1 14.1 12.4 11.5 12.3
19.1
29.5
39.1
13.7
29.0
45.8
12.0
25.2
50.4
11.8
20.1
54.0
14.8
16.5
54.6
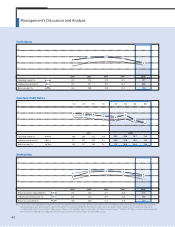
Management’s Discussion and Analysis
Sales to Domestic and Foreign Customers (Based on the location of customers)
In line with the significant increase in net sales, the cost of sales also
grew, rising 33.2%, to ¥262,944 million. Because cost of sales increased
at a rate greater than the 23.5% rise in net sales, the gross profit margin
fell to 45.4%, down 4.0 percentage points from 49.4% in the previous
year. Selling, general and administrative expenses rose 44.6%, to
¥123,613 million, with the ratio of SG&A expenses to net sales up 3.8
percentage points, from 21.9% to 25.7%. As a result, operating income
fell 11.3%, to ¥95,074 million, and the operating margin fell 7.8
percentage points, to 19.7%. Major factors included the inclusion into
the Group’s scope of consolidation from the second half of the fiscal
year of Pentax and its consolidated subsidiaries, as well as increased
production costs in pre-existing Hoya business segments and reduced
production yields for highly complex products. Also, the Group
continued its spending to ensure future growth, including capital
expenditures and marketing activities, as well as research and
development, and personnel increases. By quarter, the operating
margin in the first quarter was 23.2%, 26.6% in the second quarter,
18.7% in the third quarter and 13.3% in the fourth quarter.
Ordinary income during the year under review was ¥100,175
million, down 2.7% from the preceding fiscal year.
Net Income
40