Pentax 2008 Annual Report Download - page 54
Download and view the complete annual report
Please find page 54 of the 2008 Pentax annual report below. You can navigate through the pages in the report by either clicking on the pages listed below, or by using the keyword search tool below to find specific information within the annual report.-
 1
1 -
2
-
3
-
4
-
5
-
6
-
7
-
8
-
9
-
10
-
11
-
12
-
13
-
14
-
15
-
16
-
17
-
18
-
19
-
20
-
21
-
22
-
23
-
24
-
25
-
26
-
27
-
28
-
29
-
30
-
31
-
32
-
33
-
34
-
35
-
36
-
37
-
38
-
39
-
40
-
41
-
42
-
43
-
 44
44 -
 45
45 -
 46
46 -
 47
47 -
 48
48 -
 49
49 -
 50
50 -
 51
51 -
 52
52 -
 53
53 -
 54
54 -
 55
55 -
 56
56 -
 57
57 -
 58
58 -
 59
59 -
 60
60 -
 61
61 -
 62
62 -
 63
63 -
 64
64 -
65
-
66
-
67
-
68
-
69
-
70
-
71
-
72
-
73
-
74
-
75
-
76
-
77
-
78
-
79
-
80
-
81
-
82
-
83
-
84
-
85
-
86
-
87
-
88
-
89
-
90
-
91
-
92
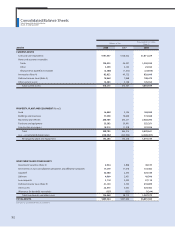
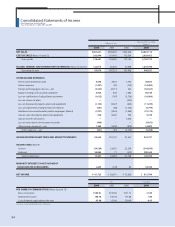
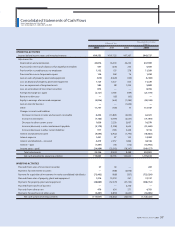
 |
 |
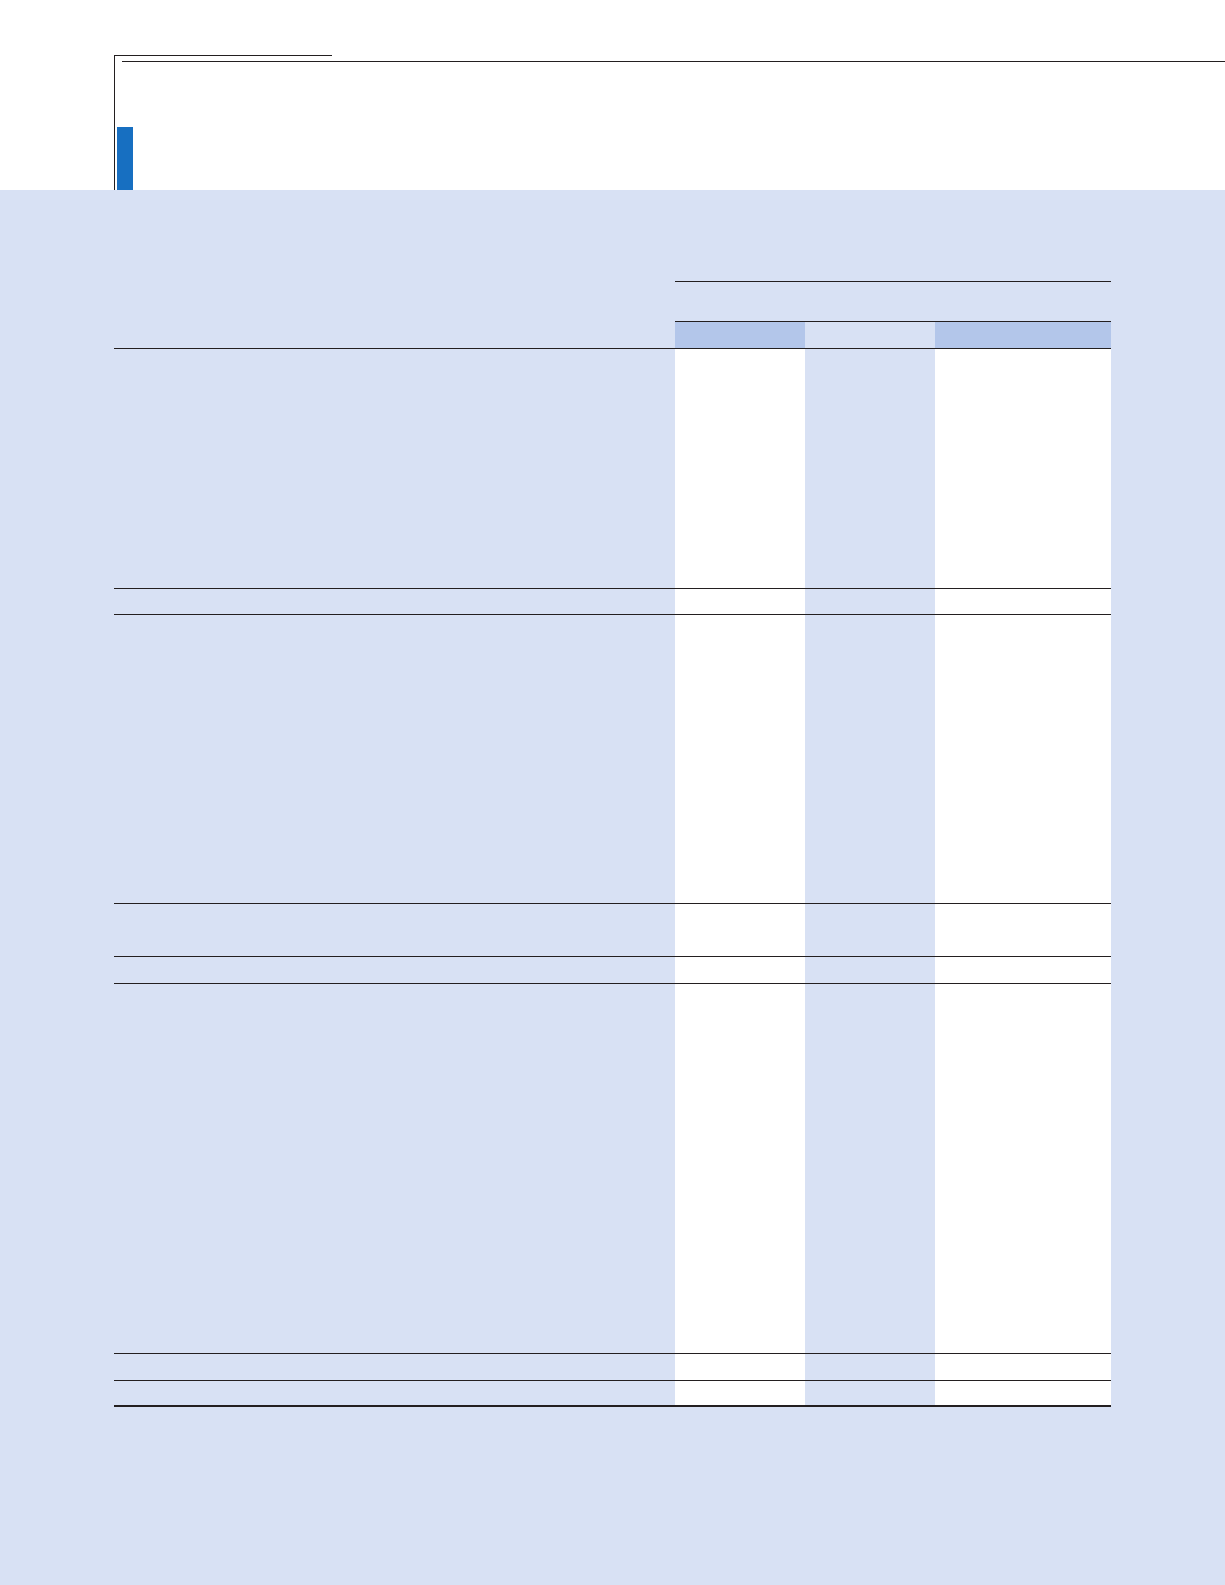
$1,811,229
1,202,934
23,945
(23,835)
826,649
108,474
145,553
4,094,949
168,560
774,508
2,502,296
352,351
101,926
3,899,641
(2,380,497)
1,519,144
49,147
172,462
326,180
49,506
37,110
410,809
225,302
(3,244)
1,267,272
$6,881,365
2008 2007 2008
CURRENT ASSETS
Cash and cash equivalents
Notes and accounts receivable
Trade
Other
Allowance for doubtful receivables
Inventories (Note 4)
Deferred income taxes (Note 9)
Other current assets
Total current assets
PROPERTY, PLANT AND EQUIPMENT (Note 5)
Land
Buildings and structures
Machinery and vehicles
Furniture and equipment
Construction in progress
Total
Less—accumulated depreciation
Net property, plant and equipment
INVESTMENTS AND OTHER ASSETS
Investment Securities (Note 3)
Investments in non-consolidated subsidiaries and affiliated companies
Goodwill
Software
Lease deposits
Deferred income taxes (Note 9)
Other assets
Allowance for doubtful receivables
Total investments and other assets
TOTAL ASSETS
¥181,467
120,522
2,399
(2,388)
82,822
10,868
14,583
410,273
16,888
77,598
250,705
35,302
10,212
390,705
(238,502)
152,203
4,924
17,279
32,680
4,960
3,718
41,159
22,573
(325)
126,968
¥689,444
¥120,622
94,297
2,142
(1,312)
49,722
7,068
3,168
275,707
9,154
70,040
245,211
29,991
11,918
366,314
(223,096)
143,218
2,898
11,678
2,243
2,431
3,435
2,724
3,632
(322)
28,719
¥447,644
Thousands of U.S. Dollars
(Note 1)
Millions of Yen
See notes to consolidated financial statements.
ASSETS
Consolidated Balance Sheets
Hoya Corporation and Subsidiaries
March 31, 2008 and 2007
52