Oracle 2005 Annual Report Download - page 99
Download and view the complete annual report
Please find page 99 of the 2005 Oracle annual report below. You can navigate through the pages in the report by either clicking on the pages listed below, or by using the keyword search tool below to find specific information within the annual report.-
 1
1 -
2
-
3
-
4
-
5
-
6
-
7
-
8
-
9
-
10
-
11
-
12
-
13
-
14
-
15
-
16
-
17
-
18
-
19
-
20
-
21
-
22
-
23
-
24
-
25
-
26
-
27
-
28
-
29
-
30
-
31
-
32
-
33
-
34
-
35
-
36
-
37
-
38
-
39
-
40
-
41
-
42
-
43
-
44
-
45
-
46
-
47
-
48
-
49
-
50
-
51
-
52
-
53
-
54
-
55
-
56
-
57
-
58
-
59
-
60
-
61
-
62
-
63
-
64
-
65
-
66
-
67
-
68
-
69
-
70
-
71
-
72
-
73
-
74
-
75
-
76
-
77
-
78
-
79
-
80
-
81
-
82
-
83
-
84
-
85
-
86
-
87
-
88
-
 89
89 -
 90
90 -
 91
91 -
 92
92 -
 93
93 -
 94
94 -
 95
95 -
 96
96 -
 97
97 -
 98
98 -
 99
99 -
 100
100 -
 101
101 -
 102
102 -
 103
103 -
 104
104 -
 105
105 -
 106
106 -
 107
107 -
 108
108 -
 109
109 -
110
-
111
-
112
-
113
-
114
-
115
-
116
-
117
-
118
 |
 |

Table of Contents
ORACLE CORPORATION
NOTES TO CONSOLIDATED FINANCIAL STATEMENTS—(Continued)
May 31, 2006
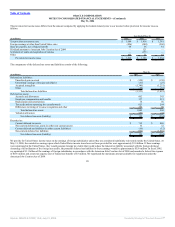
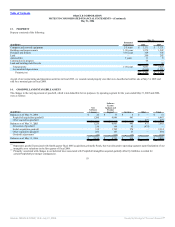
Reconciliation of operating segment revenues to total revenues
Year Ended May 31,
(in millions) 2006 2005 2004
Total revenues for reportable segments $ 14,771 $ 12,119 $ 10,156
Software license updates and product support revenues (391) (320) —
Total revenues $ 14,380 $ 11,799 $ 10,156
Reconciliation of operating segment margin to income before provision for income taxes
Year Ended May 31,
(in millions) 2006 2005 2004
Total margin for reportable segments $ 9,066 $ 7,535 $ 6,219
Software license updates and product support revenues (391) (320) —
Product development and information technology expenses (2,160) (1,771) (1,537)
Marketing and partner program expenses (447) (378) (348)
Corporate and general and administrative expenses (473) (438) (378)
Amortization of intangible assets (583) (219) (36)
Acquisition related (137) (208) (54)
Restructuring (85) (147) —
Stock-based compensation (31) (25) —
Interest expense (169) (135) (21)
Non-operating income, net 220 157 100
Income before provision for income taxes $ 4,810 $ 4,051 $ 3,945
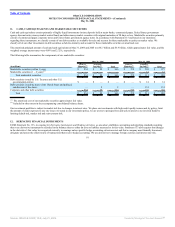
Geographic information
Disclosed in the table below is geographic information for any country comprising greater than three percent of total revenues.
Year Ended May 31,
2006 2005 2004
(in millions) Revenues
Long Lived
Assets(1) Revenues
Long Lived
Assets(1) Revenues
Long Lived
Assets(1)
United States $ 6,449 $ 1,351 $ 4,943 $ 1,371 $ 4,358 $ 876
United Kingdom 1,153 109 1,014 112 841 115
Japan 841 105 796 39 746 35
Germany 579 8 579 6 513 7
France 509 16 442 15 371 15
Canada 472 12 345 12 255 8
Other foreign countries 4,377 179 3,680 185 3,072 139
Total $ 14,380 $ 1,780 $ 11,799 $ 1,740 $ 10,156 $ 1,195
(1) Long-lived assets excludes goodwill, intangible assets, equity investments and deferred taxes, which are not allocated to specific geographic locations as it is
impracticable to do so.
96
Source: ORACLE CORP, 10-K, July 21, 2006 Powered by Morningstar® Document Research℠