Oracle 2005 Annual Report Download - page 70
Download and view the complete annual report
Please find page 70 of the 2005 Oracle annual report below. You can navigate through the pages in the report by either clicking on the pages listed below, or by using the keyword search tool below to find specific information within the annual report.-
 1
1 -
2
-
3
-
4
-
5
-
6
-
7
-
8
-
9
-
10
-
11
-
12
-
13
-
14
-
15
-
16
-
17
-
18
-
19
-
20
-
21
-
22
-
23
-
24
-
25
-
26
-
27
-
28
-
29
-
30
-
31
-
32
-
33
-
34
-
35
-
36
-
37
-
38
-
39
-
40
-
41
-
42
-
43
-
44
-
45
-
46
-
47
-
48
-
49
-
50
-
51
-
52
-
53
-
54
-
55
-
56
-
57
-
58
-
59
-
 60
60 -
 61
61 -
 62
62 -
 63
63 -
 64
64 -
 65
65 -
 66
66 -
 67
67 -
 68
68 -
 69
69 -
 70
70 -
 71
71 -
 72
72 -
 73
73 -
 74
74 -
 75
75 -
 76
76 -
 77
77 -
 78
78 -
 79
79 -
 80
80 -
81
-
82
-
83
-
84
-
85
-
86
-
87
-
88
-
89
-
90
-
91
-
92
-
93
-
94
-
95
-
96
-
97
-
98
-
99
-
100
-
101
-
102
-
103
-
104
-
105
-
106
-
107
-
108
-
109
-
110
-
111
-
112
-
113
-
114
-
115
-
116
-
117
-
118
 |
 |

Table of Contents
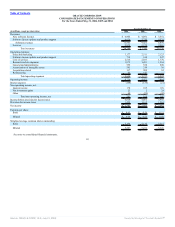
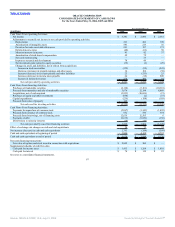
ORACLE CORPORATION
CONSOLIDATED STATEMENTS OF CASH FLOWS
For the Years Ended May 31, 2006, 2005 and 2004
Year Ended May 31,
(in millions) 2006 2005 2004
Cash Flows From Operating Activities:
Net income $ 3,381 $ 2,886 $ 2,681
Adjustments to reconcile net income to net cash provided by operating activities:
Depreciation 223 206 198
Amortization of intangible assets 583 219 36
Provision for trade receivable allowances 241 197 173
Deferred income taxes (40) (66) 58
Minority interests in income 41 42 37
Amortization of stock-based compensation 49 72 —
Non-cash restructuring — 33 —
In-process research and development 78 46 —
Net investment gains related to equity securities (39) (2) (29)
Changes in assets and liabilities, net of effects from acquisitions:
Increase in trade receivables (355) (88) (245)
Decrease (increase) in prepaid expenses and other assets 14 164 (30)
Increase (decrease) in accounts payable and other liabilities 23 (533) 25
Increase (decrease) in income taxes payable 64 (18) 200
Increase in deferred revenues 278 394 91
Net cash provided by operating activities 4,541 3,552 3,195
Cash Flows From Investing Activities:
Purchases of marketable securities (2,128) (7,101) (10,310)
Proceeds from maturities and sale of marketable securities 3,676 12,194 8,009
Acquisitions, net of cash acquired (3,953) (10,656) (21)
Purchases of equity and other investments (858) (2) (37)
Capital expenditures (236) (188) (189)
Proceeds from sales of property 140 — —
Net cash used for investing activities (3,359) (5,753) (2,548)
Cash Flows From Financing Activities:
Payments for repurchase of common stock (2,067) (1,343) (1,499)
Proceeds from issuance of common stock 632 596 354
Proceeds from borrowings, net of financing costs 12,636 12,505 6
Payments of debt (9,635) (9,830) (150)
Distributions to minority interests (39) (44) (31)
Net cash provided by (used for) financing activities 1,527 1,884 (1,320)
Effect of exchange rate changes on cash and cash equivalents 56 73 74
Net increase (decrease) in cash and cash equivalents 2,765 (244) (599)
Cash and cash equivalents at beginning of period 3,894 4,138 4,737
Cash and cash equivalents at end of period $ 6,659 $ 3,894 $ 4,138
Non-cash financing transactions:
Fair value of options and stock issued in connection with acquisitions $ 2,042 $ 504 $ —
Supplemental schedule of cash flow data:
Cash paid for income taxes $ 1,413 $ 1,268 $ 1,010
Cash paid for interest $ 74 $ 119 $ 23
See notes to consolidated financial statements.
67
Source: ORACLE CORP, 10-K, July 21, 2006 Powered by Morningstar® Document Research℠