Oracle 2005 Annual Report Download - page 43
Download and view the complete annual report
Please find page 43 of the 2005 Oracle annual report below. You can navigate through the pages in the report by either clicking on the pages listed below, or by using the keyword search tool below to find specific information within the annual report.-
 1
1 -
2
-
3
-
4
-
5
-
6
-
7
-
8
-
9
-
10
-
11
-
12
-
13
-
14
-
15
-
16
-
17
-
18
-
19
-
20
-
21
-
22
-
23
-
24
-
25
-
26
-
27
-
28
-
29
-
30
-
31
-
32
-
 33
33 -
 34
34 -
 35
35 -
 36
36 -
 37
37 -
 38
38 -
 39
39 -
 40
40 -
 41
41 -
 42
42 -
 43
43 -
 44
44 -
 45
45 -
 46
46 -
 47
47 -
 48
48 -
 49
49 -
 50
50 -
 51
51 -
 52
52 -
 53
53 -
54
-
55
-
56
-
57
-
58
-
59
-
60
-
61
-
62
-
63
-
64
-
65
-
66
-
67
-
68
-
69
-
70
-
71
-
72
-
73
-
74
-
75
-
76
-
77
-
78
-
79
-
80
-
81
-
82
-
83
-
84
-
85
-
86
-
87
-
88
-
89
-
90
-
91
-
92
-
93
-
94
-
95
-
96
-
97
-
98
-
99
-
100
-
101
-
102
-
103
-
104
-
105
-
106
-
107
-
108
-
109
-
110
-
111
-
112
-
113
-
114
-
115
-
116
-
117
-
118
 |
 |

Table of Contents
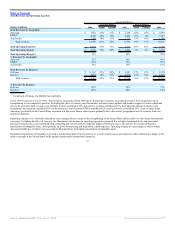
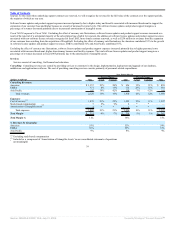
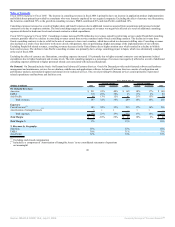
Fiscal 2006 Compared to Fiscal 2005: The increase in consulting revenues in fiscal 2006 is primarily due to an increase in application product implementations
and billable hours primarily provided by consultants who were formerly employed by our acquired companies. Excluding the effect of currency rate fluctuations,
the Americas contributed 56% to the growth in consulting revenues, EMEA contributed 26% and Asia Pacific contributed 18%.
Consulting expenses increased as a result of higher salary and benefit expenses due to additional resources acquired from acquisitions and increased external
contractor costs due to employee attrition. The total consulting margin as a percentage of revenues was negatively affected as a result of additional consulting
expenses attributed to headcount levels and external contractor related expenditures.
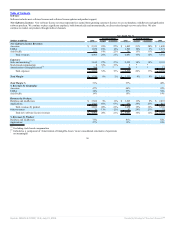
Fiscal 2005 Compared to Fiscal 2004: Consulting revenues increased $258 million due to revenues earned by performing services under PeopleSoft consulting
contracts, partially offset by a decline in consulting revenues earned from services rendered under Oracle consulting contracts. The decline in revenue from
Oracle consulting contracts is due to a shift in the mix of resources to lower cost countries, which has resulted in a decrease in billing rates. Consulting revenues
also declined as a result of our decision to work more closely with partners, who are performing a higher percentage of the implementations of our software.
Excluding PeopleSoft related revenues, consulting revenues decreased in the United States due to higher attrition rates which resulted in a decline in billable
hours and revenues. The decline in Asia Pacific consulting revenues was primarily due to a large consulting project in Japan, which was substantially completed
at the end of fiscal 2004.
Excluding the effect of currency rate fluctuations, consulting expenses increased 11% primarily due to higher external contractor costs and personnel related
expenditures due to higher headcount and revenue levels. The total consulting margin as a percentage of revenues was negatively affected as a result of additional
consulting expenses attributed to higher personnel related costs associated with increased headcount.
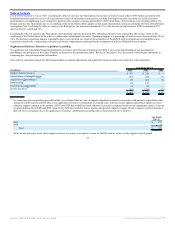
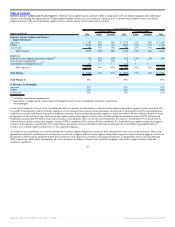
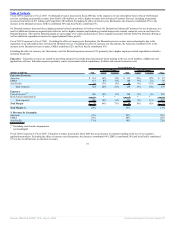
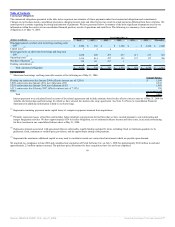
On Demand: On Demand includes Oracle On Demand and Advanced Customer Services. Oracle On Demand provides multi-featured software and hardware
management and maintenance services for our database, middleware and applications software. Advanced Customer Services consists of configuration and
performance analysis, personalized support and annual on-site technical services. The cost of providing On Demand services consist primarily of personnel
related expenditures and hardware and facilities costs.
Year Ended May 31,
Percent Change Percent Change
(Dollars in millions) 2006 Actual Constant 2005 Actual Constant 2004
On Demand Revenues:
Americas $ 231 41% 40% $ 165 18% 17% $ 140
EMEA 118 26% 32% 93 11% 3% 84
Asia Pacific 48 13% 12% 41 21% 15% 34
Total revenues 397 32% 33% 299 16% 14% 258
Expenses:
Cost of services(1) 385 52% 53% 253 17% 14% 216
Amortization of intangible assets(2)
3 * * — * * —
Total expenses 388 53% 53% 253 17% 14% 216
Total Margin $ 9 -83% -76% $ 46 10% 6% $ 42
Total Margin % 2% 15% 16%
% Revenues by Geography:
Americas 58% 55% 54%
EMEA 30% 31% 33%
Asia Pacific 12% 14% 13%
(1) Excluding stock-based compensation
(2) Included as a component of ‘Amortization of Intangible Assets’ in our consolidated statements of operations
* not meaningful
40
Source: ORACLE CORP, 10-K, July 21, 2006 Powered by Morningstar® Document Research℠