Oracle 2005 Annual Report Download - page 98
Download and view the complete annual report
Please find page 98 of the 2005 Oracle annual report below. You can navigate through the pages in the report by either clicking on the pages listed below, or by using the keyword search tool below to find specific information within the annual report.-
 1
1 -
2
-
3
-
4
-
5
-
6
-
7
-
8
-
9
-
10
-
11
-
12
-
13
-
14
-
15
-
16
-
17
-
18
-
19
-
20
-
21
-
22
-
23
-
24
-
25
-
26
-
27
-
28
-
29
-
30
-
31
-
32
-
33
-
34
-
35
-
36
-
37
-
38
-
39
-
40
-
41
-
42
-
43
-
44
-
45
-
46
-
47
-
48
-
49
-
50
-
51
-
52
-
53
-
54
-
55
-
56
-
57
-
58
-
59
-
60
-
61
-
62
-
63
-
64
-
65
-
66
-
67
-
68
-
69
-
70
-
71
-
72
-
73
-
74
-
75
-
76
-
77
-
78
-
79
-
80
-
81
-
82
-
83
-
84
-
85
-
86
-
87
-
 88
88 -
 89
89 -
 90
90 -
 91
91 -
 92
92 -
 93
93 -
 94
94 -
 95
95 -
 96
96 -
 97
97 -
 98
98 -
 99
99 -
 100
100 -
 101
101 -
 102
102 -
 103
103 -
 104
104 -
 105
105 -
 106
106 -
 107
107 -
 108
108 -
109
-
110
-
111
-
112
-
113
-
114
-
115
-
116
-
117
-
118
 |
 |

Table of Contents
ORACLE CORPORATION
NOTES TO CONSOLIDATED FINANCIAL STATEMENTS—(Continued)
May 31, 2006
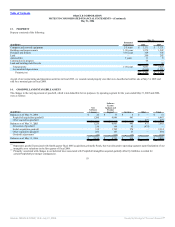
We do not track our assets by operating segments. Consequently, it is not practical to show assets by operating segments.
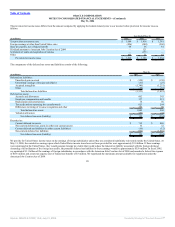
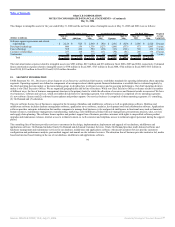
The following table presents a summary of our businesses and operating segments:
Year Ended May 31,
(in millions) 2006 2005 2004
New software licenses:
Revenues(1) $ 4,897 $ 4,082 $ 3,533
Sales and distribution expenses 2,638 2,055 1,716
Margin(2) $ 2,259 $ 2,027 $ 1,817
Software license updates and product support:
Revenues(1) $ 7,027 $ 5,650 $ 4,529
Cost of services 673 569 508
Margin(2) $ 6,354 $ 5,081 $ 4,021
Total software business:
Revenues(1) $ 11,924 $ 9,732 $ 8,062
Expenses 3,311 2,624 2,224
Margin(2) $ 8,613 $ 7,108 $ 5,838
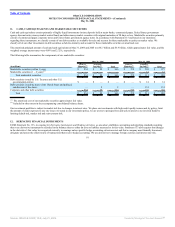
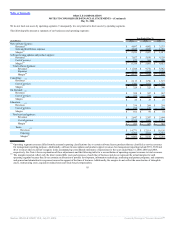
Consulting:
Revenues(1)
$ 2,113 $ 1,796 $ 1,573
Cost of services 1,787 1,471 1,273
Margin(2)
$ 326 $ 325 $ 300
On Demand:
Revenues(1)
$ 398 $ 307 $ 267
Cost of services 372 274 240
Margin(2)
$ 26 $ 33 $ 27
Education:
Revenues(1)
$ 336 $ 284 $ 254
Cost of services 235 215 200
Margin(2)
$ 101 $ 69 $ 54
Total services business:
Revenues(1)
$ 2,847 $ 2,387 $ 2,094
Cost of services 2,394 1,960 1,713
Margin(2)
$ 453 $ 427 $ 381
Totals:
Revenues(1)
$ 14,771 $ 12,119 $ 10,156
Expenses 5,705 4,584 3,937
Margin(2)
$ 9,066 $ 7,535 $ 6,219
(1) Operating segment revenues differ from the external reporting classifications due to certain software license products that are classified as service revenues
for management reporting purposes. Additionally, software license updates and product support revenues for management reporting include $391, $320 and
$0 of revenues that we did not recognize in the accompanying consolidated statements of operations for the years ended May 31, 2006, 2005 and 2004,
respectively. See Note 6 for an explanation of these adjustments and the following table for a reconciliation of operating segment revenues to total revenues.
(2) The margins reported reflect only the direct controllable costs and expenses of each line of business and do not represent the actual margins for each
operating segment because they do not contain an allocation of product development, information technology, marketing and partner programs, and corporate
and general and administrative expenses incurred in support of the lines of business. Additionally, the margins do not reflect the amortization of intangible
assets, restructuring costs, acquisition related costs and stock-based compensation.
95
Source: ORACLE CORP, 10-K, July 21, 2006 Powered by Morningstar® Document Research℠