Oracle 2005 Annual Report Download - page 36
Download and view the complete annual report
Please find page 36 of the 2005 Oracle annual report below. You can navigate through the pages in the report by either clicking on the pages listed below, or by using the keyword search tool below to find specific information within the annual report.-
 1
1 -
2
-
3
-
4
-
5
-
6
-
7
-
8
-
9
-
10
-
11
-
12
-
13
-
14
-
15
-
16
-
17
-
18
-
19
-
20
-
21
-
22
-
23
-
24
-
25
-
 26
26 -
 27
27 -
 28
28 -
 29
29 -
 30
30 -
 31
31 -
 32
32 -
 33
33 -
 34
34 -
 35
35 -
 36
36 -
 37
37 -
 38
38 -
 39
39 -
 40
40 -
 41
41 -
 42
42 -
 43
43 -
 44
44 -
 45
45 -
 46
46 -
47
-
48
-
49
-
50
-
51
-
52
-
53
-
54
-
55
-
56
-
57
-
58
-
59
-
60
-
61
-
62
-
63
-
64
-
65
-
66
-
67
-
68
-
69
-
70
-
71
-
72
-
73
-
74
-
75
-
76
-
77
-
78
-
79
-
80
-
81
-
82
-
83
-
84
-
85
-
86
-
87
-
88
-
89
-
90
-
91
-
92
-
93
-
94
-
95
-
96
-
97
-
98
-
99
-
100
-
101
-
102
-
103
-
104
-
105
-
106
-
107
-
108
-
109
-
110
-
111
-
112
-
113
-
114
-
115
-
116
-
117
-
118
 |
 |

Table of Contents
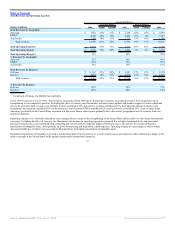
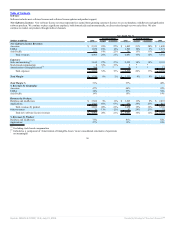
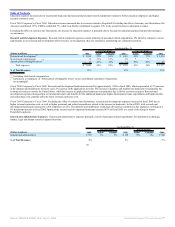
Total Revenues and Operating Expenses
Year Ended May 31,
Percent Change Percent Change
(Dollars in millions) 2006 Actual Constant 2005 Actual Constant 2004
Total Revenues by Geography:
Americas $ 7,652 32% 31% $ 5,798 16% 16% $ 4,983
EMEA(1)
4,708 10% 15% 4,288 17% 9% 3,677
Asia Pacific 2,020 18% 21% 1,713 15% 10% 1,496
Total revenues 14,380 22% 23% 11,799 16% 12% 10,156
Total Operating Expenses 9,644 24% 25% 7,777 24% 20% 6,292
Total Operating Margin $ 4,736 18% 20% $ 4,022 4% -1% $ 3,864
Total Operating Margin % 33% 34% 38%
% Revenues by Geography:
Americas 53% 49% 49%
EMEA 33% 36% 36%
Asia Pacific 14% 15% 15%
Total Revenues by Business:
Software $ 11,541 23% 24% $ 9,421 17% 13% $ 8,070
Services 2,839 19% 21% 2,378 14% 10% 2,086
Total revenues $ 14,380 22% 23% $ 11,799 16% 12% $ 10,156
% Revenues by Business:
Software 80% 80% 79%
Services 20% 20% 21%
(1) Comprised of Europe, the Middle East and Africa
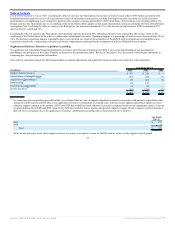
Fiscal 2006 Compared to Fiscal 2005: Total revenues increased in fiscal 2006 due to strong sales execution, incremental revenues from acquisitions and a
strengthening in our competitive position. Excluding the effect of currency rate fluctuations, software license updates and product support revenues contributed
50% to the growth in total revenues, new software licenses contributed 32% and services revenues contributed 18%. Excluding the effects of currency rate
fluctuations, the Americas contributed 65% to the increase in total revenues, EMEA contributed 22% and Asia Pacific contributed 13%. Total revenues in the
Americas, specifically in the United States, increased at a faster rate than in other regions primarily due to the relative geographical mix of revenues from our
acquired companies.
Operating expenses were favorably affected by 1 percentage point as a result of the strengthening of the United States dollar relative to other major international
currencies. Excluding the effect of currency rate fluctuations, the increase in operating expenses is primarily due to higher headcount levels and associated
personnel related costs in sales and marketing, consulting and research and development, higher commissions due to the increase in revenues and greater
amortization of intangible assets, offset partially by lower restructuring and acquisition related expenses. Operating margins as a percentage of total revenues
decreased slightly due to higher costs associated with acquisitions, principally amortization of intangible assets.
International operations will continue to provide a significant portion of total revenues. As a result, total revenues and expenses will be affected by changes in the
relative strength of the United States dollar against certain major international currencies.
33
Source: ORACLE CORP, 10-K, July 21, 2006 Powered by Morningstar® Document Research℠