Oracle 2005 Annual Report Download - page 39
Download and view the complete annual report
Please find page 39 of the 2005 Oracle annual report below. You can navigate through the pages in the report by either clicking on the pages listed below, or by using the keyword search tool below to find specific information within the annual report.-
 1
1 -
2
-
3
-
4
-
5
-
6
-
7
-
8
-
9
-
10
-
11
-
12
-
13
-
14
-
15
-
16
-
17
-
18
-
19
-
20
-
21
-
22
-
23
-
24
-
25
-
26
-
27
-
28
-
 29
29 -
 30
30 -
 31
31 -
 32
32 -
 33
33 -
 34
34 -
 35
35 -
 36
36 -
 37
37 -
 38
38 -
 39
39 -
 40
40 -
 41
41 -
 42
42 -
 43
43 -
 44
44 -
 45
45 -
 46
46 -
 47
47 -
 48
48 -
 49
49 -
50
-
51
-
52
-
53
-
54
-
55
-
56
-
57
-
58
-
59
-
60
-
61
-
62
-
63
-
64
-
65
-
66
-
67
-
68
-
69
-
70
-
71
-
72
-
73
-
74
-
75
-
76
-
77
-
78
-
79
-
80
-
81
-
82
-
83
-
84
-
85
-
86
-
87
-
88
-
89
-
90
-
91
-
92
-
93
-
94
-
95
-
96
-
97
-
98
-
99
-
100
-
101
-
102
-
103
-
104
-
105
-
106
-
107
-
108
-
109
-
110
-
111
-
112
-
113
-
114
-
115
-
116
-
117
-
118
 |
 |

Table of Contents
Software
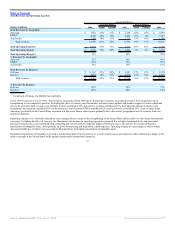
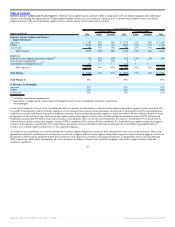
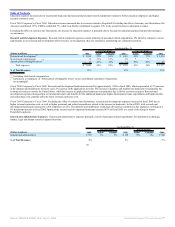
Software includes new software licenses and software license updates and product support.
New Software Licenses: New software license revenues represent fees earned from granting customers licenses to use our database, middleware and application
software products. We continue to place significant emphasis, both domestically and internationally, on direct sales through our own sales force. We also
continue to market our products through indirect channels.
Year Ended May 31,
2006
Percent Change
2005
Percent Change
2004
(Dollars in millions) Actual Constant Actual Constant
New Software License Revenues:
Americas $ 2,323 29% 27% $ 1,805 21% 20% $ 1,490
EMEA 1,650 10% 14% 1,505 10% 3% 1,371
Asia Pacific 932 19% 22% 781 15% 11% 680
Total revenues 4,905 20% 21% 4,091 16% 12% 3,541
Expenses:
Sales and marketing(1) 3,169 27% 27% 2,505 18% 14% 2,123
Stock-based compensation 8 33% 33% 6 * * —
Amortization of intangible assets(2) 208 * * 59 * * 13
Total expenses 3,385 32% 33% 2,570 20% 17% 2,136
Total Margin $ 1,520 0% 2% $ 1,521 8% 4% $ 1,405
Total Margin % 31% 37% 40%
% Revenues by Geography:
Americas 47% 44% 42%
EMEA 34% 37% 39%
Asia Pacific 19% 19% 19%
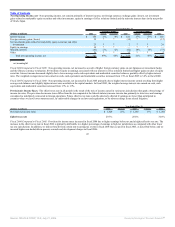
Revenues by Product:
Database and middleware $ 3,566 9% 11% $ 3,265 13% 9% $ 2,893
Applications 1,303 66% 67% 785 28% 25% 615
Total revenues by product 4,869 20% 21% 4,050 15% 12% 3,508
Other revenues 36 -13% -12% 41 24% 21% 33
Total new software license revenues $ 4,905 20% 21% $ 4,091 16% 12% $ 3,541
% Revenues by Product:
Database and middleware 73% 81% 82%
Applications 27% 19% 18%
(1) Excluding stock-based compensation
(2) Included as a component of ‘Amortization of Intangible Assets’ in our consolidated statements of operations
* not meaningful
36
Source: ORACLE CORP, 10-K, July 21, 2006 Powered by Morningstar® Document Research℠