Oracle 2005 Annual Report Download - page 40
Download and view the complete annual report
Please find page 40 of the 2005 Oracle annual report below. You can navigate through the pages in the report by either clicking on the pages listed below, or by using the keyword search tool below to find specific information within the annual report.-
 1
1 -
2
-
3
-
4
-
5
-
6
-
7
-
8
-
9
-
10
-
11
-
12
-
13
-
14
-
15
-
16
-
17
-
18
-
19
-
20
-
21
-
22
-
23
-
24
-
25
-
26
-
27
-
28
-
29
-
 30
30 -
 31
31 -
 32
32 -
 33
33 -
 34
34 -
 35
35 -
 36
36 -
 37
37 -
 38
38 -
 39
39 -
 40
40 -
 41
41 -
 42
42 -
 43
43 -
 44
44 -
 45
45 -
 46
46 -
 47
47 -
 48
48 -
 49
49 -
 50
50 -
51
-
52
-
53
-
54
-
55
-
56
-
57
-
58
-
59
-
60
-
61
-
62
-
63
-
64
-
65
-
66
-
67
-
68
-
69
-
70
-
71
-
72
-
73
-
74
-
75
-
76
-
77
-
78
-
79
-
80
-
81
-
82
-
83
-
84
-
85
-
86
-
87
-
88
-
89
-
90
-
91
-
92
-
93
-
94
-
95
-
96
-
97
-
98
-
99
-
100
-
101
-
102
-
103
-
104
-
105
-
106
-
107
-
108
-
109
-
110
-
111
-
112
-
113
-
114
-
115
-
116
-
117
-
118
 |
 |

Table of Contents
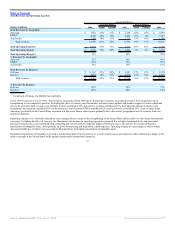
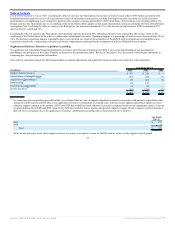
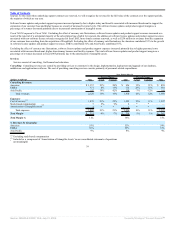
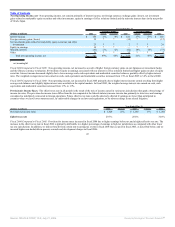
Fiscal 2006 Compared to Fiscal 2005: Excluding the effect of currency rate fluctuations, new software license revenues increased 21% due to strong sales
execution in all product lines. Applications revenues contributed 60% to the increase in new software license revenues, database revenues contributed 26% and
middleware revenues contributed 14% in fiscal 2006. Additionally, new software license revenues increased in all geographic regions. Excluding the effect of
currency rate fluctuations, the Americas contributed 57%, EMEA contributed 23% and Asia Pacific contributed 20% to the increase in new software license
revenues. New software license revenues in the Americas, specifically in the United States, increased at a faster rate than in other regions primarily due to the
relative geographical mix of revenues and location of sales personnel from our acquired companies.
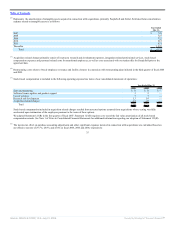
Excluding the effect of currency rate fluctuations, database and middleware revenues grew 11%. Database revenues increased 8% primarily driven by increased
demand for database option products. Middleware revenues grew 36% due to a gain in market share in the application server market as a result of better sales
execution and more competitive features and functionality. Middleware revenues also include $34 million of revenues from the licensing of Siebel products in
fiscal 2006.
Excluding the effect of currency rate fluctuations, applications revenue increased 67% as a result of increased demand for our applications products, including
products from acquired companies, better sales execution as a result of segmenting our sales force by product and a strengthening of our competitive position in
the applications market, particularly in the United States and EMEA. PeopleSoft products contributed $220 million to the growth in applications revenue in fiscal
2006, Oracle products contributed $154 million, Siebel products contributed $103 million and Retek products contributed $41 million.
New software license revenues earned from transactions over $0.5 million increased from 40% of new software license revenues in fiscal 2005 to 45% in fiscal
2006.
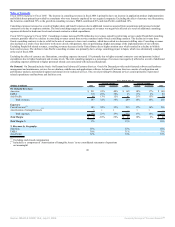
Excluding the effect of currency rate fluctuations, sales and marketing expenses increased due to higher commission expenses resulting from the growth in new
software license revenues, higher personnel related expenditures primarily associated with our expanded sales force from acquired companies and higher
advertising expenses. The total new software license margin as a percentage of revenues decreased primarily due to incremental amortization of intangible assets
and higher compensation expenses.
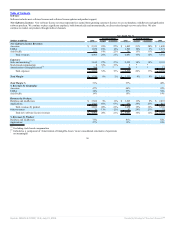
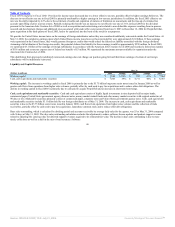
Fiscal 2005 Compared to Fiscal 2004: Excluding the effect of currency rate fluctuations, new software license revenues increased due to improved sales
execution, a strengthening in our competitive position, a stronger economy, particularly in the United States, and revenues from the licensing of PeopleSoft
products of $126 million.
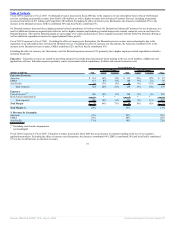
The increase in database and middleware new software license revenues was driven by a 23% increase in application server revenues and a 12% increase in
database revenues. The increase in applications new software license revenues was primarily due to revenues from the licensing of PeopleSoft products,
improved sales execution as a result of product specialization and increased demand for our products, particularly in North America. Excluding the effect of
currency rate fluctuations, the Americas contributed 71%, EMEA contributed 12% and Asia Pacific contributed 17% to the increase in new software license
revenues.
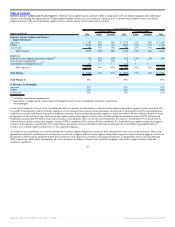
New software license revenues earned from large transactions, defined as new software license transactions over $0.5 million, increased from 37% of new
software license revenues in fiscal 2004 to 40% of new software license revenues in fiscal 2005.
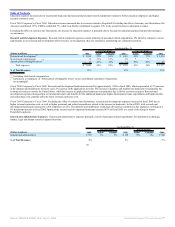
Sales and marketing expenses increased primarily due to higher commission expenses that resulted from higher revenue levels, as well as higher personnel
related costs associated with increased sales headcount. The total new software license margin as a percentage of revenues was negatively affected as a result of
higher personnel related expenditures and amortization of intangible assets.
37
Source: ORACLE CORP, 10-K, July 21, 2006 Powered by Morningstar® Document Research℠