Oracle 2005 Annual Report Download - page 48
Download and view the complete annual report
Please find page 48 of the 2005 Oracle annual report below. You can navigate through the pages in the report by either clicking on the pages listed below, or by using the keyword search tool below to find specific information within the annual report.-
 1
1 -
2
-
3
-
4
-
5
-
6
-
7
-
8
-
9
-
10
-
11
-
12
-
13
-
14
-
15
-
16
-
17
-
18
-
19
-
20
-
21
-
22
-
23
-
24
-
25
-
26
-
27
-
28
-
29
-
30
-
31
-
32
-
33
-
34
-
35
-
36
-
37
-
 38
38 -
 39
39 -
 40
40 -
 41
41 -
 42
42 -
 43
43 -
 44
44 -
 45
45 -
 46
46 -
 47
47 -
 48
48 -
 49
49 -
 50
50 -
 51
51 -
 52
52 -
 53
53 -
 54
54 -
 55
55 -
 56
56 -
 57
57 -
 58
58 -
59
-
60
-
61
-
62
-
63
-
64
-
65
-
66
-
67
-
68
-
69
-
70
-
71
-
72
-
73
-
74
-
75
-
76
-
77
-
78
-
79
-
80
-
81
-
82
-
83
-
84
-
85
-
86
-
87
-
88
-
89
-
90
-
91
-
92
-
93
-
94
-
95
-
96
-
97
-
98
-
99
-
100
-
101
-
102
-
103
-
104
-
105
-
106
-
107
-
108
-
109
-
110
-
111
-
112
-
113
-
114
-
115
-
116
-
117
-
118
 |
 |

Table of Contents
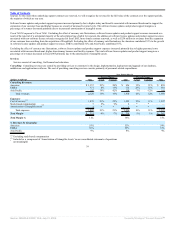
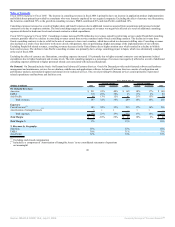
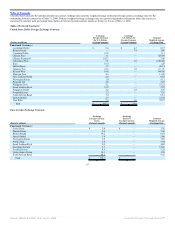
Non-Operating Income, net: Non-operating income, net consists primarily of interest income, net foreign currency exchange gains (losses), net investment
gains related to marketable equity securities and other investments, equity in earnings of i-flex solutions limited and the minority interest share in the net profits
of Oracle Japan.
Year Ended May 31,
Percent Change Percent Change
(Dollars in millions) 2006 Actual Constant 2005 Actual Constant 2004
Interest income $ 170 -8% -8% $ 185 57% 53% $ 118
Foreign currency gains (losses) 39 * * (14) * * (13)
Net investment gains related to marketable equity securities and other
investments 25 * * 2 * * 29
Equity in earnings 14 * * — * * —
Minority interest (41) -2% -2% (42) 14% 14% (37)
Other 36 * * 33 * * 5
Total non-operating income, net $ 243 49% 50% $ 164 61% 58% $ 102
* not meaningful
Fiscal 2006 Compared to Fiscal 2005: Non-operating income, net increased as a result of higher foreign currency gains on our Japanese net investment hedge
and the Chinese currency revaluation, $14 million of equity in earnings associated with our interest in i-flex solutions limited and higher gains on sales of equity
securities. Interest income decreased slightly due to lower average cash, cash equivalents and marketable securities balances, partially offset by higher interest
rates. The weighted average interest rate earned on cash, cash equivalents and marketable securities increased from 1.9% in fiscal 2005 to 3.0% in fiscal 2006.
Fiscal 2005 Compared to Fiscal 2004: Non-operating income, net increased in fiscal 2005 primarily due to higher interest income earned resulting from higher
average cash balances and slightly higher interest rates available in the capital markets. In fiscal 2005, the weighted average interest rate earned on cash, cash
equivalents and marketable securities increased from 1.5% to 1.9%.
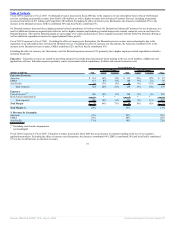
Provision for Income Taxes: The effective tax rate in all periods is the result of the mix of income earned in various tax jurisdictions that apply a broad range of
income tax rates. The provision for income taxes differs from the tax computed at the federal statutory income tax rate due primarily to state taxes and earnings
considered as indefinitely reinvested in foreign operations. Future effective tax rates could be adversely affected if earnings are lower than anticipated in
countries where we have lower statutory rates, by unfavorable changes in tax laws and regulations, or by adverse rulings in tax related litigation.
Year Ended May 31,
(Dollars in millions) 2006 Change 2005 Change 2004
Provision for income taxes $ 1,429 23% $ 1,165 -8% $ 1,264
Effective tax rate 29.7% 28.8% 32.0%
Fiscal 2006 Compared to Fiscal 2005: Provision for income taxes increased in fiscal 2006 due to higher earnings before tax and a higher effective tax rate. The
increase in the effective tax rate in fiscal 2006 is primarily attributable to a higher percentage of earnings in high tax jurisdictions as compared with other lower
tax rate jurisdictions. In addition, we did not benefit from certain non-recurring tax events in fiscal 2006 that occurred in fiscal 2005, as described below, and we
incurred higher non-deductible in-process research and development charges in fiscal 2006.
45
Source: ORACLE CORP, 10-K, July 21, 2006 Powered by Morningstar® Document Research℠