Neiman Marcus 2010 Annual Report Download - page 61
Download and view the complete annual report
Please find page 61 of the 2010 Neiman Marcus annual report below. You can navigate through the pages in the report by either clicking on the pages listed below, or by using the keyword search tool below to find specific information within the annual report.-
 1
1 -
2
-
3
-
4
-
5
-
6
-
7
-
8
-
9
-
10
-
11
-
12
-
13
-
14
-
15
-
16
-
17
-
18
-
19
-
20
-
21
-
22
-
23
-
24
-
25
-
26
-
27
-
28
-
29
-
30
-
31
-
32
-
33
-
34
-
35
-
36
-
37
-
38
-
39
-
40
-
41
-
42
-
43
-
44
-
45
-
46
-
47
-
48
-
49
-
50
-
 51
51 -
 52
52 -
 53
53 -
 54
54 -
 55
55 -
 56
56 -
 57
57 -
 58
58 -
 59
59 -
 60
60 -
 61
61 -
 62
62 -
 63
63 -
 64
64 -
 65
65 -
 66
66 -
 67
67 -
 68
68 -
 69
69 -
 70
70 -
 71
71 -
72
-
73
-
74
-
75
-
76
-
77
-
78
-
79
-
80
-
81
-
82
-
83
-
84
-
85
-
86
-
87
-
88
-
89
-
90
-
91
-
92
-
93
-
94
-
95
-
96
-
97
-
98
-
99
-
100
-
101
-
102
-
103
-
104
-
105
-
106
-
107
-
108
-
109
-
110
-
111
-
112
-
113
-
114
-
115
-
116
-
117
-
118
-
119
-
120
-
121
-
122
-
123
-
124
-
125
-
126
-
127
-
128
-
129
-
130
-
131
-
132
-
133
-
134
-
135
-
136
-
137
-
138
-
139
-
140
-
141
-
142
-
143
-
144
-
145
-
146
-
147
-
148
-
149
-
150
-
151
-
152
-
153
-
154
-
155
-
156
-
157
-
158
-
159
-
160
-
161
-
162
-
163
-
164
-
165
-
166
-
167
-
168
-
169
-
170
-
171
-
172
-
173
-
174
-
175
-
176
-
177
-
178
-
179
-
180
-
181
-
182
-
183
-
184
-
185
 |
 |

Table of Contents
2011 Executive Officer Compensation
Ultimately, our named executive officers' total compensation is based on the level of performance of the Company, and/or the
Company's business unit or division, and their individual target performance levels. The Compensation Committee uses its discretion
in making decisions on the overall compensation packages of our executive officers based on current market conditions, business
trends, and overall Company performance.
We have identified an industry peer group that includes the 16 companies listed below for purposes of benchmarking the
compensation of our named executive officers. These companies are intended to represent our competitors for business and talent.
Their executive compensation programs are compared to ours, as well as the compensation of individual executives if the jobs are
sufficiently similar to make the comparison meaningful. The comparison data is generally used to ensure that the compensation of our
named executive officers, both individually and as a whole, is appropriately competitive relative to our Company's performance. We
believe that this practice is appropriate in light of the high level of commitment, job demands, and the expected performance
contribution required from each of our executive officers. We generally target our direct compensation to be positioned between the
50th and 75th percentile levels of the compensation packages received by executives in our peer group of industry related companies.
Although no formal compensation benchmarking was performed in fiscal year 2011, the last formal benchmarking process (which was
conducted in fiscal year 2008) positioned our executives on average at the market 54th percentile on a target total direct compensation
basis.
Abercrombie & Fitch Liz Claiborne
Ann Taylor Nordstrom
Coach Polo Ralph Lauren
Macy's Saks
The Gap Talbots
Jones Apparel Tiffany & Co.
Kohl's Tommy Hilfiger
Limited Brands Williams Sonoma
In addition to the select companies above, we also review various third party compensation survey reports.
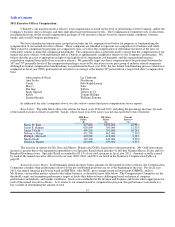
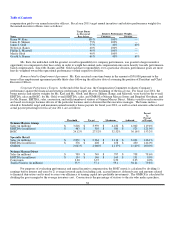
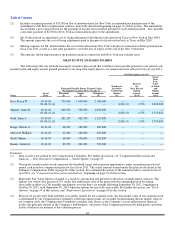
Base Salary. The table below shows the salaries for fiscal years 2010 and 2011, including the percentage increase, for each
of the named executive officers except Mr. Tansky, whose fiscal year 2011 salary was not increased due to his retirement.
2010 Base
Salary
($)
2011 Base
Salary
($)
Percent
Increase
(%)
Karen W. Katz 897,600 1,050,000 16.98%
James E. Skinner 628,800 700,000 11.32%
James J. Gold 499,200 750,000 50.24%
Nelson A. Bangs 451,200 462,000 2.39%
Phillip L. Maxwell 403,200 412,000 2.18%
Marita Glodt 429,100 440,000 2.54%
Gerald A. Barnes 425,000 435,000 2.35%
The increase in salaries for Ms. Katz and Messrs. Skinner and Gold is larger due to their promotions. Mr. Gold's percentage
increase is greater due to the expanded responsibility over Specialty Retail which includes 41 full-line Neiman Marcus Stores and two
Bergdorf Goodman stores. Specialty Retail accounted for 81.1% of our total revenues in fiscal year 2011. Amounts actually earned
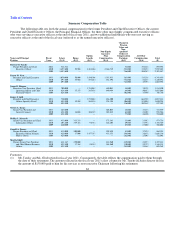
by each of the named executive officers in fiscal years 2009, 2010, and 2011 are listed in the Summary Compensation Table on
page 62.
Annual Incentive Bonus. In determining annual incentive bonus amounts for the named executive officers, the Compensation
Committee considers their performance relative to the pre-established goals that are set at the beginning of the year. For fiscal year
2011, the annual financial goals were based on EBITDA, sales, ROIC, gross margin return on investment (GMROI), and for
Mr. Barnes, certain other metrics related to the online business, as described more fully below. The Compensation Committee set the
threshold, target, and maximum performance targets at levels they believed were challenging based on historical company
performance and industry and market conditions. Goals were established at the division and business unit levels where appropriate for
each of the named executive officers. As it relates to our annual incentive compensation program, this performance assessment is a
key variable in determining the amount of total
57