Neiman Marcus 2010 Annual Report Download - page 120
Download and view the complete annual report
Please find page 120 of the 2010 Neiman Marcus annual report below. You can navigate through the pages in the report by either clicking on the pages listed below, or by using the keyword search tool below to find specific information within the annual report.-
 1
1 -
2
-
3
-
4
-
5
-
6
-
7
-
8
-
9
-
10
-
11
-
12
-
13
-
14
-
15
-
16
-
17
-
18
-
19
-
20
-
21
-
22
-
23
-
24
-
25
-
26
-
27
-
28
-
29
-
30
-
31
-
32
-
33
-
34
-
35
-
36
-
37
-
38
-
39
-
40
-
41
-
42
-
43
-
44
-
45
-
46
-
47
-
48
-
49
-
50
-
51
-
52
-
53
-
54
-
55
-
56
-
57
-
58
-
59
-
60
-
61
-
62
-
63
-
64
-
65
-
66
-
67
-
68
-
69
-
70
-
71
-
72
-
73
-
74
-
75
-
76
-
77
-
78
-
79
-
80
-
81
-
82
-
83
-
84
-
85
-
86
-
87
-
88
-
89
-
90
-
91
-
92
-
93
-
94
-
95
-
96
-
97
-
98
-
99
-
100
-
101
-
102
-
103
-
104
-
105
-
106
-
107
-
108
-
109
-
 110
110 -
 111
111 -
 112
112 -
 113
113 -
 114
114 -
 115
115 -
 116
116 -
 117
117 -
 118
118 -
 119
119 -
 120
120 -
 121
121 -
 122
122 -
 123
123 -
 124
124 -
 125
125 -
 126
126 -
 127
127 -
 128
128 -
 129
129 -
 130
130 -
131
-
132
-
133
-
134
-
135
-
136
-
137
-
138
-
139
-
140
-
141
-
142
-
143
-
144
-
145
-
146
-
147
-
148
-
149
-
150
-
151
-
152
-
153
-
154
-
155
-
156
-
157
-
158
-
159
-
160
-
161
-
162
-
163
-
164
-
165
-
166
-
167
-
168
-
169
-
170
-
171
-
172
-
173
-
174
-
175
-
176
-
177
-
178
-
179
-
180
-
181
-
182
-
183
-
184
-
185
 |
 |

Table of Contents
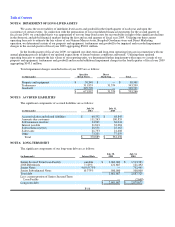
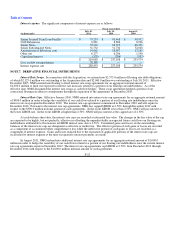
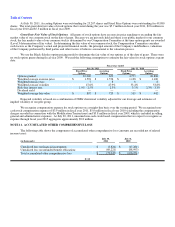
A reconciliation of income tax expense (benefit) to the amount calculated based on the federal and state statutory rates is as
follows:
Fiscal year ended
(in thousands)
July 30,
2011
July 31,
2010
August 1,
2009
Income tax expense (benefit) at statutory rate $ 17,242 $ (1,860) $ (310,972)
State income taxes, net of federal income tax benefit 874 (1,666) (23,311)
Impairment of nondeductible goodwill — — 115,398
Tax expense (benefit) related to tax settlements and other
changes in tax liabilities 153 354 (378)
Impact of non-taxable income (169) (245) (897)
Impact of non-deductible expenses 77 73 82
Other (536)(131)(367)
Total $ 17,641 $ (3,475) $ (220,445)
Effective tax rate 35.8% 65.4% 24.8%
In fiscal year 2011, we generated net income before income taxes of approximately $49.3 million, which resulted in a
recorded income tax expense of approximately $17.6 million and an effective tax rate of 35.8%. In fiscal year 2011, our effective tax
rate exceeded the statutory rate primarily due to state income taxes and settlements with taxing authorities. In fiscal year 2010, we
generated a loss before income taxes of approximately $5.3 million, which resulted in a recorded income tax benefit of approximately
$3.5 million and an effective tax rate of 65.4%. The effective tax rate for fiscal year 2010 exceeded the statutory rate primarily due to
the relative significance of state taxes, non-taxable income and non-deductible expense to our pretax loss.
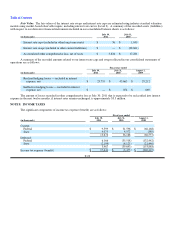
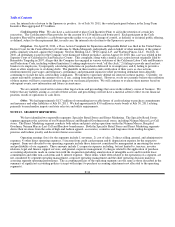
Significant components of our net deferred income tax asset (liability) are as follows:
(in thousands)
July 30,
2011
July 31,
2010
Deferred income tax assets:
Accruals and reserves $ 21,473 $ 48,106
Employee benefits 119,412 141,902
Other 22,773 30,401
Total deferred tax assets $ 163,658 $ 220,409
Deferred income tax liabilities:
Inventory $ (10,928) $ (12,094)
Depreciation and amortization (73,181) (76,933)
Intangible assets (734,485) (759,124)
Other (8,527)(10,150)
Total deferred tax liabilities (827,121)(858,301)
Net deferred income tax liability $ (663,463) $ (637,892)
Net deferred income tax asset (liability):
Current $ 20,445 $ 30,755
Non-current (683,908)(668,647)
Total $ (663,463)$ (637,892)
The net deferred tax liability of $663.5 million at July 30, 2011 increased from $637.9 million at July 31, 2010. This increase
was comprised primarily of 1) $26.8 million decrease in deferred tax assets related to the decrease in our pension liability and 2) $22.1
million decrease in deferred tax assets related to deferred interest expense, offset by 3) $24.6 million decrease in deferred tax liabilities
related to the amortization of certain intangible assets. We believe it is more likely than not that we will realize the benefits of our
recorded deferred tax assets.
F-24