Neiman Marcus 2010 Annual Report Download - page 36
Download and view the complete annual report
Please find page 36 of the 2010 Neiman Marcus annual report below. You can navigate through the pages in the report by either clicking on the pages listed below, or by using the keyword search tool below to find specific information within the annual report.-
 1
1 -
2
-
3
-
4
-
5
-
6
-
7
-
8
-
9
-
10
-
11
-
12
-
13
-
14
-
15
-
16
-
17
-
18
-
19
-
20
-
21
-
22
-
23
-
24
-
25
-
 26
26 -
 27
27 -
 28
28 -
 29
29 -
 30
30 -
 31
31 -
 32
32 -
 33
33 -
 34
34 -
 35
35 -
 36
36 -
 37
37 -
 38
38 -
 39
39 -
 40
40 -
 41
41 -
 42
42 -
 43
43 -
 44
44 -
 45
45 -
 46
46 -
47
-
48
-
49
-
50
-
51
-
52
-
53
-
54
-
55
-
56
-
57
-
58
-
59
-
60
-
61
-
62
-
63
-
64
-
65
-
66
-
67
-
68
-
69
-
70
-
71
-
72
-
73
-
74
-
75
-
76
-
77
-
78
-
79
-
80
-
81
-
82
-
83
-
84
-
85
-
86
-
87
-
88
-
89
-
90
-
91
-
92
-
93
-
94
-
95
-
96
-
97
-
98
-
99
-
100
-
101
-
102
-
103
-
104
-
105
-
106
-
107
-
108
-
109
-
110
-
111
-
112
-
113
-
114
-
115
-
116
-
117
-
118
-
119
-
120
-
121
-
122
-
123
-
124
-
125
-
126
-
127
-
128
-
129
-
130
-
131
-
132
-
133
-
134
-
135
-
136
-
137
-
138
-
139
-
140
-
141
-
142
-
143
-
144
-
145
-
146
-
147
-
148
-
149
-
150
-
151
-
152
-
153
-
154
-
155
-
156
-
157
-
158
-
159
-
160
-
161
-
162
-
163
-
164
-
165
-
166
-
167
-
168
-
169
-
170
-
171
-
172
-
173
-
174
-
175
-
176
-
177
-
178
-
179
-
180
-
181
-
182
-
183
-
184
-
185
 |
 |

Table of Contents
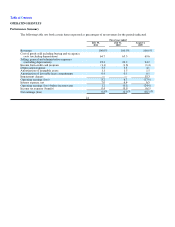
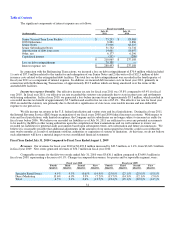
Internet revenues generated by Direct Marketing operation were $574.0 million for fiscal year 2010, an increase of 10.7%
compared to the prior fiscal year. Catalog revenues decreased 19.2% compared to the prior fiscal year as our customers continued to
migrate toward online retailing.
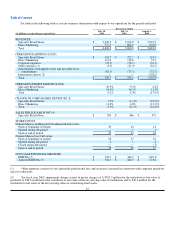
Cost of goods sold including buying and occupancy costs (excluding depreciation). COGS for fiscal year 2010 was 65.5%
of revenues compared to 69.6% of revenues for fiscal year 2009. The decrease in COGS by 4.1% of revenues for fiscal year 2010 was
primarily due to:
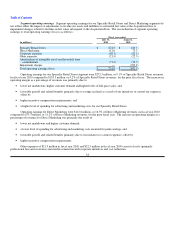
• increased product margins generated by both our Specialty Retail Stores and Direct Marketing operation of approximately
3.9% of revenues due to 1) lower net markdowns as a result of the closer alignment of on-hand inventories to customer
demand in fiscal year 2010 and 2) increases in customer demand and higher levels of full-price sales; and
• lower buying and occupancy costs of 0.2% of revenues primarily due to the leveraging of these expenses on higher revenues.
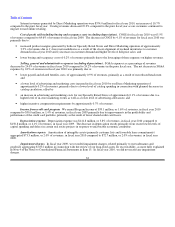
Selling, general and administrative expenses (excluding depreciation). SG&A expenses as a percentage of revenues
decreased to 24.0% of revenues in fiscal year 2010 compared to 24.2% of revenues in the prior fiscal year. The net decrease in SG&A
expenses by 0.2% of revenues in fiscal year 2010 was primarily due to:
• lower payroll and related benefits costs, of approximately 0.9% of revenues, primarily as a result of our reduced headcount;
and
• a lower level of advertising and marketing costs incurred in fiscal year 2010 by our Direct Marketing operation of
approximately 0.2% of revenues, primarily due to a lower level of catalog spending in connection with planned decreases in
catalog circulation; offset by
• an increase in advertising and marketing costs for our Specialty Retail Stores of approximately 0.1% of revenues due to a
higher level of in-store marketing events as well as a lower level of advertising allowances; and
• higher incentive compensation requirements by approximately 0.7% of revenues.
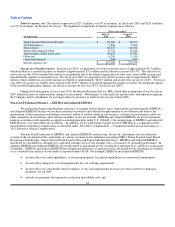
Income from credit card program. We earned Program Income of $59.1 million, or 1.6% of revenues, in fiscal year 2010
compared to $50.0 million, or 1.4% of revenues, in fiscal year 2009 primarily due to improvements in the profitability and
performance of the credit card portfolio, primarily as the result of lower shared credit card losses.
Depreciation expense. Depreciation expense was $141.8 million, or 3.8% of revenues, in fiscal year 2010 compared to
$150.8 million, or 4.1% of revenues, in fiscal year 2009. The decrease in depreciation results primarily from recent lower levels of
capital spending and delays in certain real estate projects in response to unfavorable economic conditions.
Amortization expense. Amortization of intangible assets (primarily customer lists and favorable lease commitments)
aggregated $73.3 million, or 2.0% of revenues, in fiscal year 2010 compared to $72.7 million, or 2.0% of revenues, in fiscal year
2009.
Impairment charges. In fiscal year 2009, we recorded impairment charges, related primarily to our tradenames and
goodwill, aggregating $703.2 million in connection with the review of our long-lived assets for recoverability, as more fully explained
in Note 4 of the Notes to Consolidated Financial Statements in Item 15. In fiscal year 2010, we did not record any impairment
charges.
32