Neiman Marcus 2010 Annual Report Download - page 21
Download and view the complete annual report
Please find page 21 of the 2010 Neiman Marcus annual report below. You can navigate through the pages in the report by either clicking on the pages listed below, or by using the keyword search tool below to find specific information within the annual report.-
 1
1 -
2
-
3
-
4
-
5
-
6
-
7
-
8
-
9
-
10
-
 11
11 -
 12
12 -
 13
13 -
 14
14 -
 15
15 -
 16
16 -
 17
17 -
 18
18 -
 19
19 -
 20
20 -
 21
21 -
 22
22 -
 23
23 -
 24
24 -
 25
25 -
 26
26 -
 27
27 -
 28
28 -
 29
29 -
 30
30 -
 31
31 -
32
-
33
-
34
-
35
-
36
-
37
-
38
-
39
-
40
-
41
-
42
-
43
-
44
-
45
-
46
-
47
-
48
-
49
-
50
-
51
-
52
-
53
-
54
-
55
-
56
-
57
-
58
-
59
-
60
-
61
-
62
-
63
-
64
-
65
-
66
-
67
-
68
-
69
-
70
-
71
-
72
-
73
-
74
-
75
-
76
-
77
-
78
-
79
-
80
-
81
-
82
-
83
-
84
-
85
-
86
-
87
-
88
-
89
-
90
-
91
-
92
-
93
-
94
-
95
-
96
-
97
-
98
-
99
-
100
-
101
-
102
-
103
-
104
-
105
-
106
-
107
-
108
-
109
-
110
-
111
-
112
-
113
-
114
-
115
-
116
-
117
-
118
-
119
-
120
-
121
-
122
-
123
-
124
-
125
-
126
-
127
-
128
-
129
-
130
-
131
-
132
-
133
-
134
-
135
-
136
-
137
-
138
-
139
-
140
-
141
-
142
-
143
-
144
-
145
-
146
-
147
-
148
-
149
-
150
-
151
-
152
-
153
-
154
-
155
-
156
-
157
-
158
-
159
-
160
-
161
-
162
-
163
-
164
-
165
-
166
-
167
-
168
-
169
-
170
-
171
-
172
-
173
-
174
-
175
-
176
-
177
-
178
-
179
-
180
-
181
-
182
-
183
-
184
-
185
 |
 |

Table of Contents
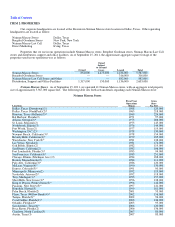
ITEM 2. PROPERTIES
Our corporate headquarters are located at the Downtown Neiman Marcus store location in Dallas, Texas. Other operating
headquarters are located as follow:
Neiman Marcus Stores Dallas, Texas
Bergdorf Goodman Stores New York, New York
Neiman Marcus Last Call Dallas, Texas
Direct Marketing Irving, Texas
Properties that we use in our operations include Neiman Marcus stores, Bergdorf Goodman stores, Neiman Marcus Last Call
stores and distribution, support and office facilities. As of September 15, 2011, the approximate aggregate square footage of the
properties used in our operations was as follows:
Owned
Owned
Subject
to Ground
Lease Leased Total
Neiman Marcus Stores 854,000 2,275,000 2,438,000 5,567,000
Bergdorf Goodman Stores — — 316,000 316,000
Neiman Marcus Last Call Stores and Other — — 882,000 882,000
Distribution, Support and Office Facilities 1,317,000 150,000 1,136,000 2,603,000
Neiman Marcus Stores. As of September 15, 2011, we operated 41 Neiman Marcus stores, with an aggregate total property
size of approximately 5,567,000 square feet. The following table sets forth certain details regarding each Neiman Marcus store:
Neiman Marcus Stores
Locations
Fiscal Year
Operations
Began
Gross
Store
Sq. Feet
Dallas, Texas (Downtown)(1) 1908 129,000
Dallas, Texas (NorthPark)(2)* 1965 218,000
Houston, Texas (Galleria)(3)* 1969 224,000
Bal Harbour, Florida(2) 1971 97,000
Atlanta, Georgia(2)* 1973 206,000
St. Louis, Missouri(2) 1975 145,000
Northbrook, Illinois(3) 1976 144,000
Fort Worth, Texas(2) 1977 119,000
Washington, D.C.(2)* 1978 130,000
Newport Beach, California(3)* 1978 154,000
Beverly Hills, California(1)* 1979 185,000
Westchester, New York(2)* 1981 138,000
Las Vegas, Nevada(2) 1981 174,000
Oak Brook, Illinois(2) 1982 119,000
San Diego, California(2) 1982 106,000
Fort Lauderdale, Florida(3)* 1983 94,000
San Francisco, California(4)* 1983 251,000
Chicago, Illinois (Michigan Ave.)(2) 1984 188,000
Boston, Massachusetts(2) 1984 111,000
Palo Alto, California(3)* 1986 120,000
McLean, Virginia(4)* 1990 130,000
Denver, Colorado(3)* 1991 90,000
Minneapolis, Minnesota(2) 1992 119,000
Scottsdale, Arizona(2)* 1992 118,000
Troy, Michigan(3)* 1993 157,000
Short Hills, New Jersey(3)* 1996 138,000
King of Prussia, Pennsylvania(3)* 1996 142,000
Paramus, New Jersey(3)* 1997 141,000
Honolulu, Hawaii(3) 1999 181,000
Palm Beach, Florida(2) 2001 53,000
Plano, Texas (Willow Bend)(4)* 2002 156,000
Tampa, Florida(3)* 2002 96,000
Coral Gables, Florida(2)* 2003 136,000
Orlando, Florida(4)* 2003 95,000
San Antonio, Texas(4)* 2006 120,000
Boca Raton, Florida(2) 2006 136,000
Charlotte, North Carolina(3) 2007 80,000
Austin, Texas(3) 2007 80,000