Neiman Marcus 2010 Annual Report Download - page 133
Download and view the complete annual report
Please find page 133 of the 2010 Neiman Marcus annual report below. You can navigate through the pages in the report by either clicking on the pages listed below, or by using the keyword search tool below to find specific information within the annual report.-
 1
1 -
2
-
3
-
4
-
5
-
6
-
7
-
8
-
9
-
10
-
11
-
12
-
13
-
14
-
15
-
16
-
17
-
18
-
19
-
20
-
21
-
22
-
23
-
24
-
25
-
26
-
27
-
28
-
29
-
30
-
31
-
32
-
33
-
34
-
35
-
36
-
37
-
38
-
39
-
40
-
41
-
42
-
43
-
44
-
45
-
46
-
47
-
48
-
49
-
50
-
51
-
52
-
53
-
54
-
55
-
56
-
57
-
58
-
59
-
60
-
61
-
62
-
63
-
64
-
65
-
66
-
67
-
68
-
69
-
70
-
71
-
72
-
73
-
74
-
75
-
76
-
77
-
78
-
79
-
80
-
81
-
82
-
83
-
84
-
85
-
86
-
87
-
88
-
89
-
90
-
91
-
92
-
93
-
94
-
95
-
96
-
97
-
98
-
99
-
100
-
101
-
102
-
103
-
104
-
105
-
106
-
107
-
108
-
109
-
110
-
111
-
112
-
113
-
114
-
115
-
116
-
117
-
118
-
119
-
120
-
121
-
122
-
 123
123 -
 124
124 -
 125
125 -
 126
126 -
 127
127 -
 128
128 -
 129
129 -
 130
130 -
 131
131 -
 132
132 -
 133
133 -
 134
134 -
 135
135 -
 136
136 -
 137
137 -
 138
138 -
 139
139 -
 140
140 -
 141
141 -
 142
142 -
 143
143 -
144
-
145
-
146
-
147
-
148
-
149
-
150
-
151
-
152
-
153
-
154
-
155
-
156
-
157
-
158
-
159
-
160
-
161
-
162
-
163
-
164
-
165
-
166
-
167
-
168
-
169
-
170
-
171
-
172
-
173
-
174
-
175
-
176
-
177
-
178
-
179
-
180
-
181
-
182
-
183
-
184
-
185
 |
 |

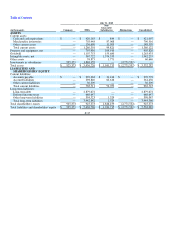
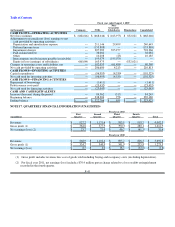
Table of Contents
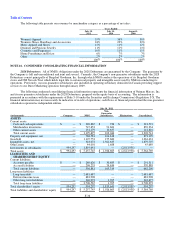
July 31, 2010
(in thousands) Company NMG
Non-
Guarantor
Subsidiaries Eliminations Consolidated
ASSETS
Current assets:
Cash and cash equivalents $ — $ 420,163 $ 844 $ — $ 421,007
Merchandise inventories — 703,448 87,068 — 790,516
Other current assets — 136,690 11,909 — 148,599
Total current assets — 1,260,301 99,821 — 1,360,122
Property and equipment, net — 795,916 109,910 — 905,826
Goodwill — 1,107,753 155,680 — 1,263,433
Intangible assets, net — 367,722 1,574,533 — 1,942,255
Other assets — 58,875 1,771 — 60,646
Investments in subsidiaries 925,373 1,846,159 — (2,771,532)—
Total assets $ 925,373 $ 5,436,726 $ 1,941,715 $ (2,771,532) $ 5,532,282
LIABILITIES AND
SHAREHOLDERS' EQUITY
Current liabilities:
Accounts payable $ — $ 239,362 $ 31,416 $ — $ 270,778
Accrued liabilities — 298,840 62,616 — 361,456
Other current liabilities — 30,309 — — 30,309
Total current liabilities — 568,511 94,032 — 662,543
Long-term liabilities:
Long-term debt — 2,879,672 — — 2,879,672
Deferred income taxes — 668,647 — — 668,647
Other long-term liabilities — 394,523 1,524 — 396,047
Total long-term liabilities — 3,942,842 1,524 — 3,944,366
Total shareholders' equity 925,373 925,373 1,846,159 (2,771,532)925,373
Total liabilities and shareholders' equity $ 925,373 $ 5,436,726 $ 1,941,715 $ (2,771,532)$ 5,532,282
F-37