Neiman Marcus 2010 Annual Report Download - page 135
Download and view the complete annual report
Please find page 135 of the 2010 Neiman Marcus annual report below. You can navigate through the pages in the report by either clicking on the pages listed below, or by using the keyword search tool below to find specific information within the annual report.-
 1
1 -
2
-
3
-
4
-
5
-
6
-
7
-
8
-
9
-
10
-
11
-
12
-
13
-
14
-
15
-
16
-
17
-
18
-
19
-
20
-
21
-
22
-
23
-
24
-
25
-
26
-
27
-
28
-
29
-
30
-
31
-
32
-
33
-
34
-
35
-
36
-
37
-
38
-
39
-
40
-
41
-
42
-
43
-
44
-
45
-
46
-
47
-
48
-
49
-
50
-
51
-
52
-
53
-
54
-
55
-
56
-
57
-
58
-
59
-
60
-
61
-
62
-
63
-
64
-
65
-
66
-
67
-
68
-
69
-
70
-
71
-
72
-
73
-
74
-
75
-
76
-
77
-
78
-
79
-
80
-
81
-
82
-
83
-
84
-
85
-
86
-
87
-
88
-
89
-
90
-
91
-
92
-
93
-
94
-
95
-
96
-
97
-
98
-
99
-
100
-
101
-
102
-
103
-
104
-
105
-
106
-
107
-
108
-
109
-
110
-
111
-
112
-
113
-
114
-
115
-
116
-
117
-
118
-
119
-
120
-
121
-
122
-
123
-
124
-
 125
125 -
 126
126 -
 127
127 -
 128
128 -
 129
129 -
 130
130 -
 131
131 -
 132
132 -
 133
133 -
 134
134 -
 135
135 -
 136
136 -
 137
137 -
 138
138 -
 139
139 -
 140
140 -
 141
141 -
 142
142 -
 143
143 -
 144
144 -
 145
145 -
146
-
147
-
148
-
149
-
150
-
151
-
152
-
153
-
154
-
155
-
156
-
157
-
158
-
159
-
160
-
161
-
162
-
163
-
164
-
165
-
166
-
167
-
168
-
169
-
170
-
171
-
172
-
173
-
174
-
175
-
176
-
177
-
178
-
179
-
180
-
181
-
182
-
183
-
184
-
185
 |
 |

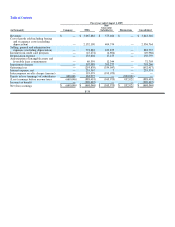
Table of Contents
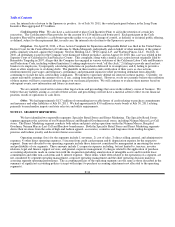
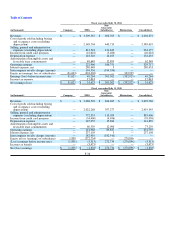
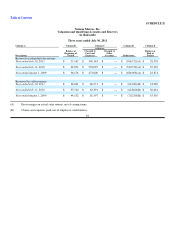
Fiscal year ended August 1, 2009
(in thousands) Company NMG
Non-
Guarantor
Subsidiaries Eliminations Consolidated
Revenues $ — $ 3,067,882 $ 575,464 $ — $ 3,643,346
Cost of goods sold including buying
and occupancy costs (excluding
depreciation) — 2,132,190 404,574 — 2,536,764
Selling, general and administrative
expenses (excluding depreciation) — 772,882 109,855 — 882,737
Income from credit card program — (45,272) (4,694) — (49,966)
Depreciation expense — 133,604 17,155 — 150,759
Amortization of intangible assets and
favorable lease commitments — 60,359 12,344 — 72,703
Impairment charges — 307,989 395,277 703,266
Operating loss — (293,870) (359,047) — (652,917)
Interest expense, net — 235,567 7 — 235,574
Intercompany royalty charges (income) — 195,079 (195,079) — —
Equity in loss (earnings) of subsidiaries 668,046 163,975 — (832,021)—
(Loss) earnings before income taxes (668,046) (888,491) (163,975) 832,021 (888,491)
Income tax benefit — (220,445)— — (220,445)
Net (loss) earnings $ (668,046)$ (668,046)$ (163,975)$ 832,021 $ (668,046)
F-39