Neiman Marcus 2010 Annual Report Download - page 102
Download and view the complete annual report
Please find page 102 of the 2010 Neiman Marcus annual report below. You can navigate through the pages in the report by either clicking on the pages listed below, or by using the keyword search tool below to find specific information within the annual report.-
 1
1 -
2
-
3
-
4
-
5
-
6
-
7
-
8
-
9
-
10
-
11
-
12
-
13
-
14
-
15
-
16
-
17
-
18
-
19
-
20
-
21
-
22
-
23
-
24
-
25
-
26
-
27
-
28
-
29
-
30
-
31
-
32
-
33
-
34
-
35
-
36
-
37
-
38
-
39
-
40
-
41
-
42
-
43
-
44
-
45
-
46
-
47
-
48
-
49
-
50
-
51
-
52
-
53
-
54
-
55
-
56
-
57
-
58
-
59
-
60
-
61
-
62
-
63
-
64
-
65
-
66
-
67
-
68
-
69
-
70
-
71
-
72
-
73
-
74
-
75
-
76
-
77
-
78
-
79
-
80
-
81
-
82
-
83
-
84
-
85
-
86
-
87
-
88
-
89
-
90
-
91
-
 92
92 -
 93
93 -
 94
94 -
 95
95 -
 96
96 -
 97
97 -
 98
98 -
 99
99 -
 100
100 -
 101
101 -
 102
102 -
 103
103 -
 104
104 -
 105
105 -
 106
106 -
 107
107 -
 108
108 -
 109
109 -
 110
110 -
 111
111 -
 112
112 -
113
-
114
-
115
-
116
-
117
-
118
-
119
-
120
-
121
-
122
-
123
-
124
-
125
-
126
-
127
-
128
-
129
-
130
-
131
-
132
-
133
-
134
-
135
-
136
-
137
-
138
-
139
-
140
-
141
-
142
-
143
-
144
-
145
-
146
-
147
-
148
-
149
-
150
-
151
-
152
-
153
-
154
-
155
-
156
-
157
-
158
-
159
-
160
-
161
-
162
-
163
-
164
-
165
-
166
-
167
-
168
-
169
-
170
-
171
-
172
-
173
-
174
-
175
-
176
-
177
-
178
-
179
-
180
-
181
-
182
-
183
-
184
-
185
 |
 |

Table of Contents
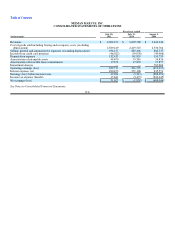
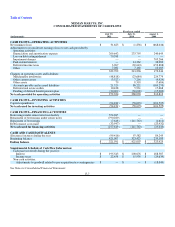
NEIMAN MARCUS, INC.
CONSOLIDATED STATEMENTS OF OPERATIONS
Fiscal year ended
(in thousands)
July 30,
2011
July 31,
2010
August 1,
2009
Revenues $ 4,002,272 $ 3,692,768 $ 3,643,346
Cost of goods sold including buying and occupancy costs (excluding
depreciation) 2,589,419 2,419,545 2,536,764
Selling, general and administrative expenses (excluding depreciation) 934,177 885,406 882,737
Income from credit card program (46,022) (59,076) (49,966)
Depreciation expense 132,433 141,839 150,759
Amortization of intangible assets 44,670 55,381 54,826
Amortization of favorable lease commitments 17,878 17,878 17,877
Impairment charges — — 703,266
Operating earnings (loss) 329,717 231,795 (652,917)
Interest expense, net 280,453 237,108 235,574
Earnings (loss) before income taxes 49,264 (5,313) (888,491)
Income tax expense (benefit) 17,641 (3,475)(220,445)
Net earnings (loss) $ 31,623 $ (1,838)$ (668,046)
See Notes to Consolidated Financial Statements.
F-6