Neiman Marcus 2010 Annual Report Download - page 38
Download and view the complete annual report
Please find page 38 of the 2010 Neiman Marcus annual report below. You can navigate through the pages in the report by either clicking on the pages listed below, or by using the keyword search tool below to find specific information within the annual report.-
 1
1 -
2
-
3
-
4
-
5
-
6
-
7
-
8
-
9
-
10
-
11
-
12
-
13
-
14
-
15
-
16
-
17
-
18
-
19
-
20
-
21
-
22
-
23
-
24
-
25
-
26
-
27
-
 28
28 -
 29
29 -
 30
30 -
 31
31 -
 32
32 -
 33
33 -
 34
34 -
 35
35 -
 36
36 -
 37
37 -
 38
38 -
 39
39 -
 40
40 -
 41
41 -
 42
42 -
 43
43 -
 44
44 -
 45
45 -
 46
46 -
 47
47 -
 48
48 -
49
-
50
-
51
-
52
-
53
-
54
-
55
-
56
-
57
-
58
-
59
-
60
-
61
-
62
-
63
-
64
-
65
-
66
-
67
-
68
-
69
-
70
-
71
-
72
-
73
-
74
-
75
-
76
-
77
-
78
-
79
-
80
-
81
-
82
-
83
-
84
-
85
-
86
-
87
-
88
-
89
-
90
-
91
-
92
-
93
-
94
-
95
-
96
-
97
-
98
-
99
-
100
-
101
-
102
-
103
-
104
-
105
-
106
-
107
-
108
-
109
-
110
-
111
-
112
-
113
-
114
-
115
-
116
-
117
-
118
-
119
-
120
-
121
-
122
-
123
-
124
-
125
-
126
-
127
-
128
-
129
-
130
-
131
-
132
-
133
-
134
-
135
-
136
-
137
-
138
-
139
-
140
-
141
-
142
-
143
-
144
-
145
-
146
-
147
-
148
-
149
-
150
-
151
-
152
-
153
-
154
-
155
-
156
-
157
-
158
-
159
-
160
-
161
-
162
-
163
-
164
-
165
-
166
-
167
-
168
-
169
-
170
-
171
-
172
-
173
-
174
-
175
-
176
-
177
-
178
-
179
-
180
-
181
-
182
-
183
-
184
-
185
 |
 |

Table of Contents
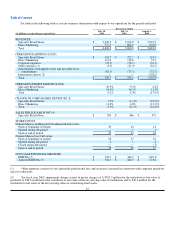
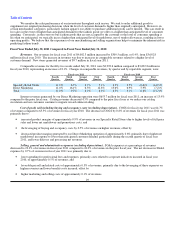
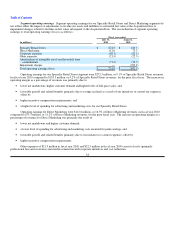
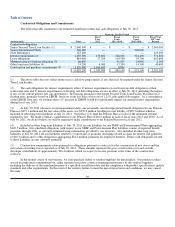
Interest expense, net. Net interest expense was $237.1 million, or 6.4% of revenues, in fiscal year 2010 and $235.6 million,
or 6.5% of revenues, for the prior fiscal year. The significant components of interest expense are as follows:
Fiscal year ended
(in thousands)
July 31,
2010
August 1,
2009
Senior Secured Term Loan Facility $ 83,468 $ 90,952
2028 Debentures 8,886 8,906
Senior Notes 68,315 66,356
Senior Subordinated Notes 51,732 52,028
Amortization of debt issue costs 18,697 17,185
Other, net 6,296 1,140
Capitalized interest (286)(993)
Interest expense, net $ 237,108 $ 235,574
Income tax (benefit) expense. In fiscal year 2010, we generated a loss before income taxes of approximately $5.3 million,
which resulted in a recorded income tax benefit of approximately $3.5 million and an effective tax rate of 65.4%. The effective tax
rate for fiscal year 2010 exceeded the statutory rate primarily due to the relative significance of state taxes, non-taxable income and
non-deductible expense to our pretax loss. For fiscal year 2009, we generated a loss before income taxes of approximately $888.5
million, which resulted in a recorded income tax benefit of approximately $220.5 million and an effective tax rate of 24.8%. For fiscal
year 2009, no income tax benefit exists related to the $329.7 million of goodwill impairment charges recorded. Excluding the impact
of the goodwill impairment charges, our effective income tax rate was 39.5% for fiscal year 2009.
During the fourth quarter of fiscal year 2010, the Internal Revenue Service (IRS) closed their examination of our fiscal year
2007 federal income tax return with no changes or assessments. With respect to state and local jurisdictions, with limited exceptions,
the Company and its subsidiaries are no longer subject to income tax audits for fiscal years before 2006.
Non-GAAP Financial Measure — EBITDA and Adjusted EBITDA
We present the financial performance measures of earnings before interest, taxes, depreciation and amortization (EBITDA)
and Adjusted EBITDA because we use these measures to monitor and evaluate the performance of our business and believe the
presentation of these measures will enhance investors' ability to analyze trends in our business, evaluate our performance relative to
other companies in our industry and evaluate our ability to service our debt. EBITDA and Adjusted EBITDA are not presentations
made in accordance with generally accepted accounting principles in the U.S. (GAAP). Our computations of EBITDA and Adjusted
EBITDA may vary from others in our industry. In addition, we use performance targets based on EBITDA as a component of the
measurement of incentive compensation as described under "Executive Compensation — Compensation Discussion and Analysis —
2011 Executive Officer Compensation."
The non-GAAP measures of EBITDA and Adjusted EBITDA contain some, but not all, adjustments that are taken into
account in the calculation of the components of various covenants in the indentures governing NMG's Senior Secured Asset-Based
Revolving Credit Facility, Senior Secured Term Loan Facility and Senior Subordinated Notes. EBITDA and Adjusted EBITDA
should not be considered as alternatives to operating earnings (loss) or net earnings (loss) as measures of operating performance. In
addition, EBITDA and Adjusted EBITDA are not presented as and should not be considered as alternatives to cash flows as measures
of liquidity. EBITDA and Adjusted EBITDA have important limitations as analytical tools and should not be considered in isolation,
or as a substitute for analysis of our results as reported under GAAP. For example, EBITDA and Adjusted EBITDA:
• do not reflect our cash expenditures, or future requirements, for capital expenditures or contractual commitments;
• do not reflect changes in, or cash requirements for, our working capital needs;
• do not reflect our considerable interest expense, or the cash requirements necessary to service interest or principal
payments, on our debt;
• exclude tax payments that represent a reduction in available cash; and
34