Neiman Marcus 2010 Annual Report Download - page 101
Download and view the complete annual report
Please find page 101 of the 2010 Neiman Marcus annual report below. You can navigate through the pages in the report by either clicking on the pages listed below, or by using the keyword search tool below to find specific information within the annual report.-
 1
1 -
2
-
3
-
4
-
5
-
6
-
7
-
8
-
9
-
10
-
11
-
12
-
13
-
14
-
15
-
16
-
17
-
18
-
19
-
20
-
21
-
22
-
23
-
24
-
25
-
26
-
27
-
28
-
29
-
30
-
31
-
32
-
33
-
34
-
35
-
36
-
37
-
38
-
39
-
40
-
41
-
42
-
43
-
44
-
45
-
46
-
47
-
48
-
49
-
50
-
51
-
52
-
53
-
54
-
55
-
56
-
57
-
58
-
59
-
60
-
61
-
62
-
63
-
64
-
65
-
66
-
67
-
68
-
69
-
70
-
71
-
72
-
73
-
74
-
75
-
76
-
77
-
78
-
79
-
80
-
81
-
82
-
83
-
84
-
85
-
86
-
87
-
88
-
89
-
90
-
 91
91 -
 92
92 -
 93
93 -
 94
94 -
 95
95 -
 96
96 -
 97
97 -
 98
98 -
 99
99 -
 100
100 -
 101
101 -
 102
102 -
 103
103 -
 104
104 -
 105
105 -
 106
106 -
 107
107 -
 108
108 -
 109
109 -
 110
110 -
 111
111 -
112
-
113
-
114
-
115
-
116
-
117
-
118
-
119
-
120
-
121
-
122
-
123
-
124
-
125
-
126
-
127
-
128
-
129
-
130
-
131
-
132
-
133
-
134
-
135
-
136
-
137
-
138
-
139
-
140
-
141
-
142
-
143
-
144
-
145
-
146
-
147
-
148
-
149
-
150
-
151
-
152
-
153
-
154
-
155
-
156
-
157
-
158
-
159
-
160
-
161
-
162
-
163
-
164
-
165
-
166
-
167
-
168
-
169
-
170
-
171
-
172
-
173
-
174
-
175
-
176
-
177
-
178
-
179
-
180
-
181
-
182
-
183
-
184
-
185
 |
 |
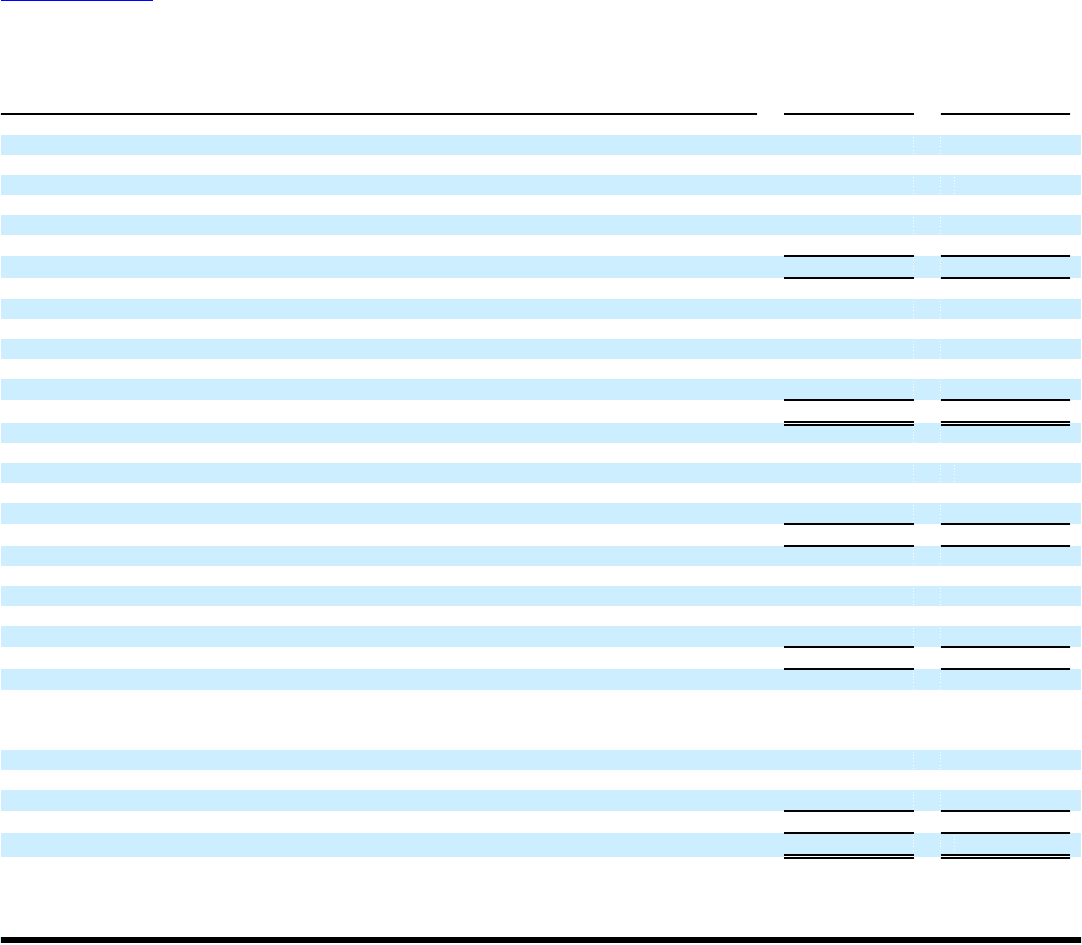
Table of Contents
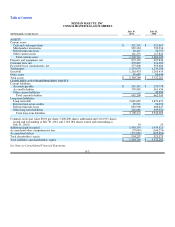
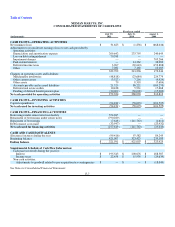
NEIMAN MARCUS, INC.
CONSOLIDATED BALANCE SHEETS
(in thousands, except shares)
July 30,
2011
July 31,
2010
ASSETS
Current assets:
Cash and cash equivalents $ 321,591 $ 421,007
Merchandise inventories 839,334 790,516
Deferred income taxes 20,445 30,755
Other current assets 121,371 117,844
Total current assets 1,302,741 1,360,122
Property and equipment, net 873,199 905,826
Customer lists, net 270,829 314,389
Favorable lease commitments, net 375,808 393,686
Tradenames 1,233,070 1,234,180
Goodwill 1,263,433 1,263,433
Other assets 45,689 60,646
Total assets $ 5,364,769 $ 5,532,282
LIABILITIES AND SHAREHOLDERS' EQUITY
Current liabilities:
Accounts payable $ 291,311 $ 270,778
Accrued liabilities 370,889 361,456
Other current liabilities — 30,309
Total current liabilities 662,200 662,543
Long-term liabilities:
Long-term debt 2,681,687 2,879,672
Deferred real estate credits 99,991 96,093
Deferred income taxes 683,908 668,647
Other long-term liabilities 242,686 299,954
Total long-term liabilities 3,708,272 3,944,366
Common stock (par value $0.01 per share, 5,000,000 shares authorized and 1,014,915 shares
issued and outstanding at July 30, 2011 and 1,013,082 shares issued and outstanding at
July 31, 2010) 10 10
Additional paid-in capital 1,438,393 1,434,321
Accumulated other comprehensive loss (73,045) (106,274)
Accumulated deficit (371,061)(402,684)
Total shareholders' equity 994,297 925,373
Total liabilities and shareholders' equity $ 5,364,769 $ 5,532,282
See Notes to Consolidated Financial Statements.
F-5